flextra_visualiser

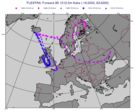
Visualises the results of the FLEXTRA trajectory model.
Tip
A tutorial on using FLEXTRA from within Metview is available here.
Note
This function performs the same task as the Flextra Visualiser icon in Metview’s user interface. It accepts its parameters as keyword arguments, described below.
- flextra_visualiser(**kwargs)
Visualises the results of the FLEXTRA trajectory model.
- Parameters
flextra_plot_type (str, default: "geo_points") –
flextra_plot_content (str, default: "trajectory") –
flextra_filename (str, default: "off") –
flextra_data (str) –
flextra_group_index (number, default: 1) –
flextra_x_variable (str, default: "date") –
flextra_y_variable (str, default: "pressure") –
flextra_label_variable (str, default: "time") –
flextra_label_period ({"6h", "12h", "24h", "48h"}, default: "12h") –
- Return type
Request