Gallery
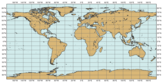
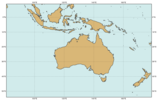
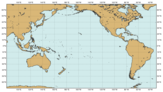
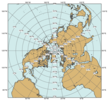
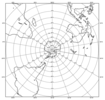
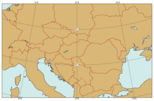
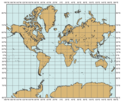
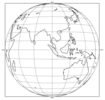
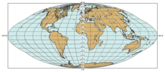
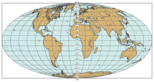
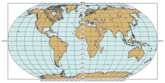
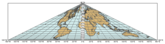
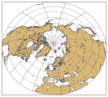
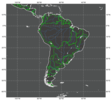
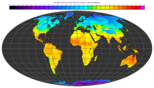
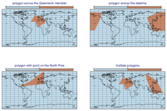
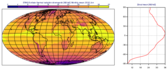
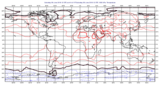
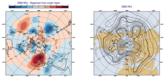
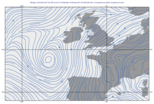
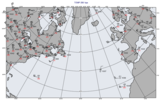
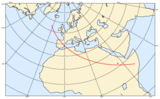
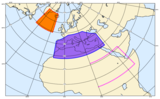
Map projections
These examples feature various map projections.
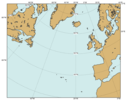
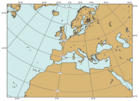


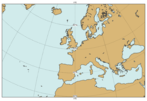
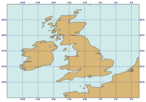
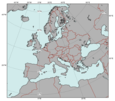
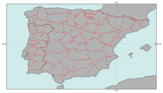
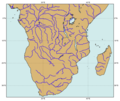
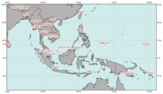
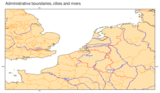
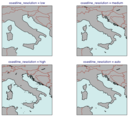
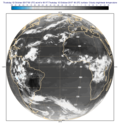
Coastlines
These examples feature coastlines settings.
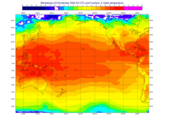
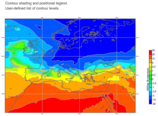
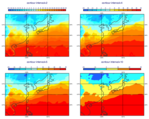
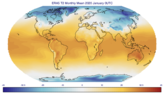
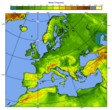
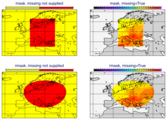
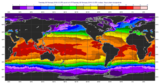
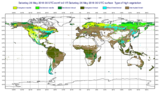
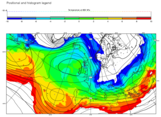
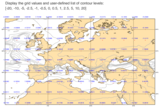
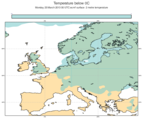
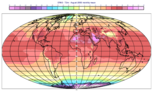
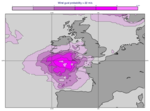
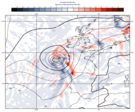
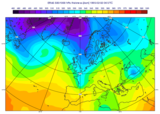
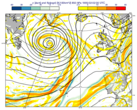
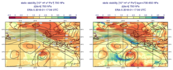
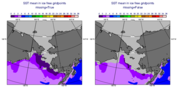
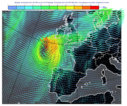
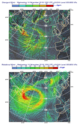
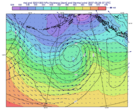
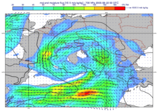
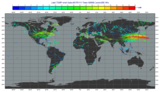
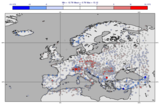
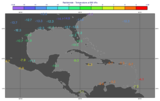
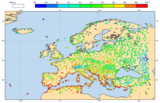
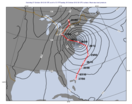
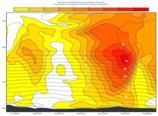
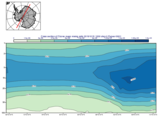
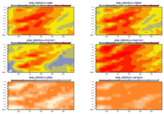
Gridded scalar data on map
These examples feature map plots with gridded scalar data.
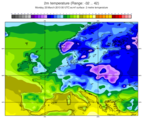
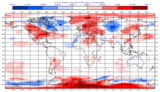
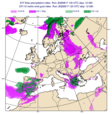
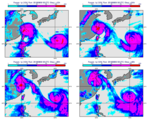
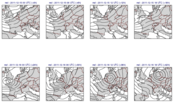
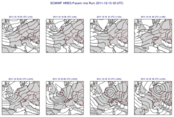
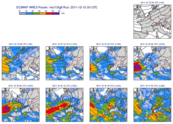
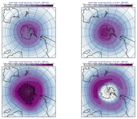
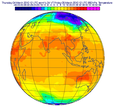
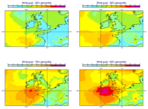
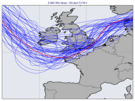
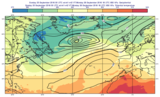
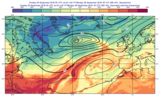
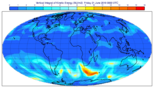
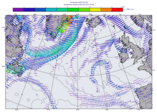
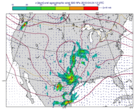
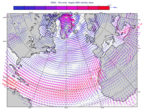
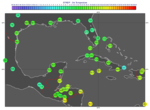
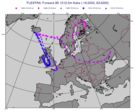
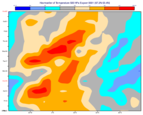
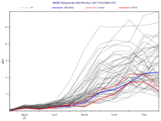
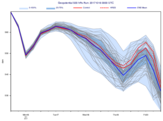
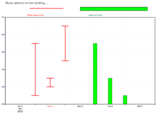
Ensemble data on map
These examples feature map plots with ensemble forecast data.
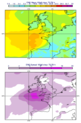
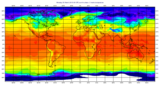
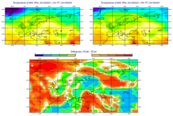
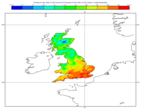
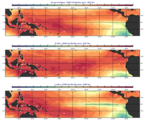
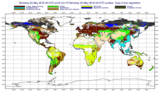
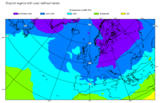
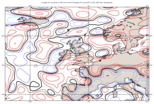
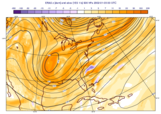
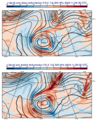
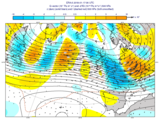
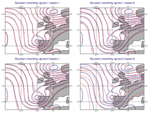
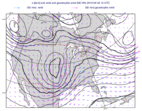
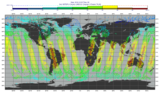
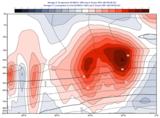
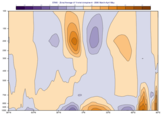
Computed scalar data on map
These examples feature some computations resulting in gridded scalar data.
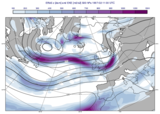

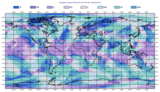
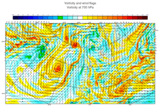
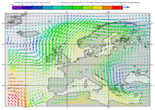
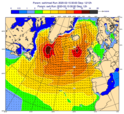
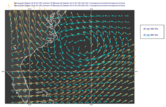
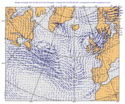
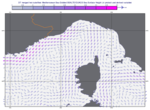
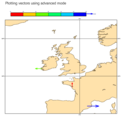
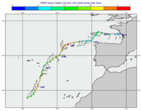
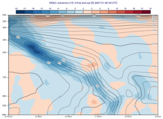
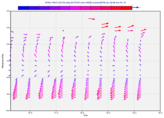
Vector data on map
These examples feature map plots with vector data.

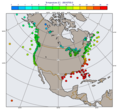
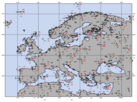
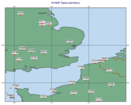
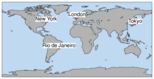
Point data on map
These examples feature map plots with point data.
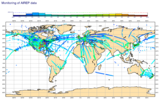
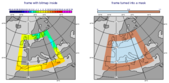
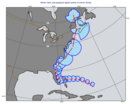
Tracks and curves on map
These examples feature map plots with tracks, curves and shapes.

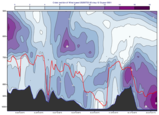
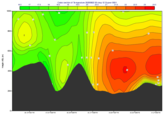
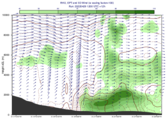
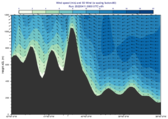
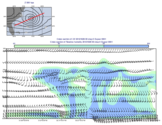
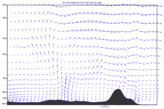
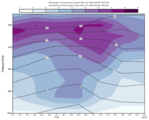
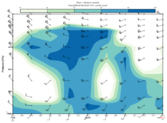
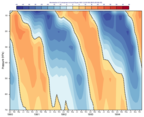
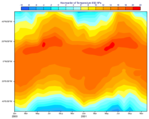
Vertical cross sections
These examples feature vertical cross sections.
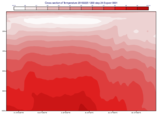
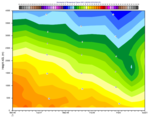
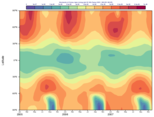
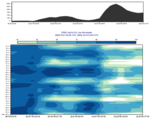
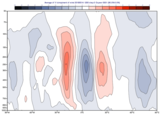
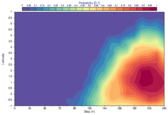
Hovmoeller diagrams
These examples feature Hovmoeller diagrams.
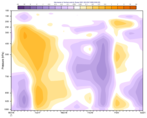
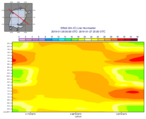
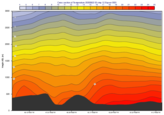
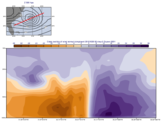
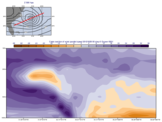
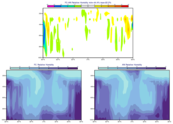
Average sections
These examples feature average vertical sections.
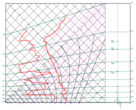
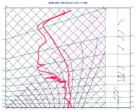
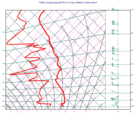
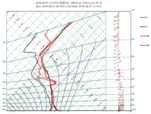
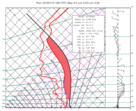
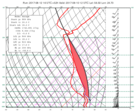
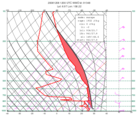
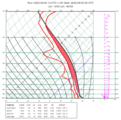
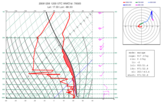
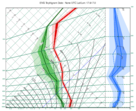
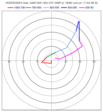
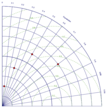
Thermodynamic diagrams
These examples feature thermodynamic diagrams (tephigram and skew-t) and hodographs.
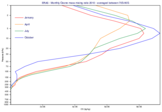
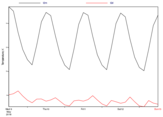
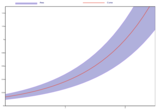
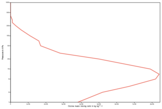
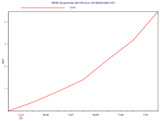
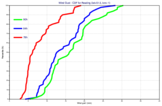
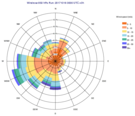
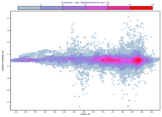
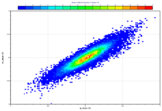
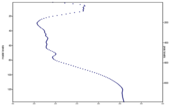
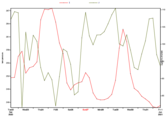
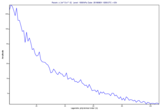
XY plots
These examples feature various xy plots: time-series, profiles, scatterplots and Taylor diagrams.
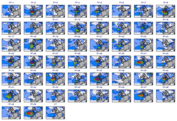
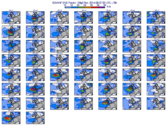
Animated gifs
These examples show how to generate animated gifs.