spec_graph

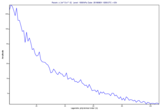
Defines the visualisation of the spectrum as a function of Legendre polynomial order from spectral (spherical harmonics) GRIB data. Only the first field in a Fieldset is used.
Note
This function performs the same task as the Spectra icon in Metview’s user interface. It accepts its parameters as keyword arguments, described below.
- spec_graph(**kwargs)
Defines visualisation for the spectrum of the first field in the input spectral GRIB data.
- Parameters
data (
Fieldset) – Specifies the spectral (spherical harmonics) GRIB data.truncation (number, default: 216) – specifies the highest wave number in spectra plots.
- Return type
Request