Generating Animated GIFS in Metview Macro
The following macro retrieves several time steps of data from MARS, plots them to a PostScript file and uses the convert command to generate an animated gif. The result is shown on this page.
# Metview Macro

# ***************************\* LICENSE START **********************************
#
# Copyright 2014- ECMWF. This software is distributed under the terms
# of the Apache License version 2.0. In applying this license, ECMWF does not
# waive the privileges and immunities granted to it by virtue of its status as
# an Intergovernmental Organization or submit itself to any jurisdiction.
#
# ****************************\* LICENSE END ***********************************

# retrieve some data from MARS
t2m_fc = retrieve(
  type : "fc",
  levtype:"sfc",
  param : "2t",
  time : 00,
  step : [00,"to",72,"by",6],
  grid : [1.5,1.5]
)

# define our plotting attributes
t_shade = mcont(
  legend : "on",
  contour_automatic_setting : "ecchart"
)

view = geoview(
  map_area_definition : "corners",
  area : [30.62,\ -\ 25.4,70.12,40.36]
)

# plot the data
outdir = getenv('SCRATCH')
outbasename = "t2m_fc"
ps = ps_output(output_name : outdir & "/" & outbasename)
setoutput(ps)

plot(view, t2m_fc, t_shade)

# force Macro to wait for the plot to be generated, then convert
# to animated gif

setoutput(ps) # wait for the plot file to be generated

shell('convert -delay 100 -rotate "90<" ' & outdir & '/' &
outbasename & '.ps ' & outdir & '/' & outbasename & '.gif')
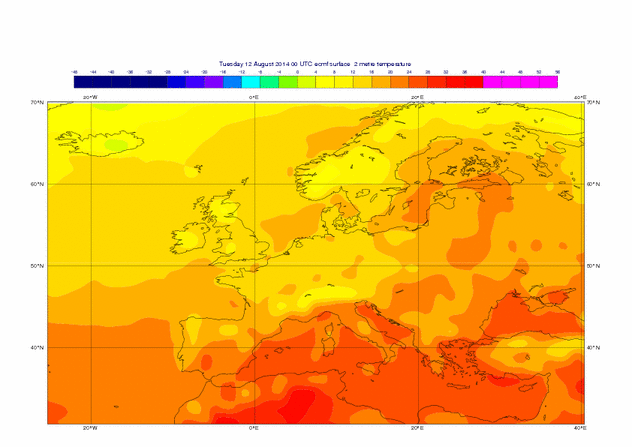
The resulting image looks like this: