Note
Click here to download the full example code
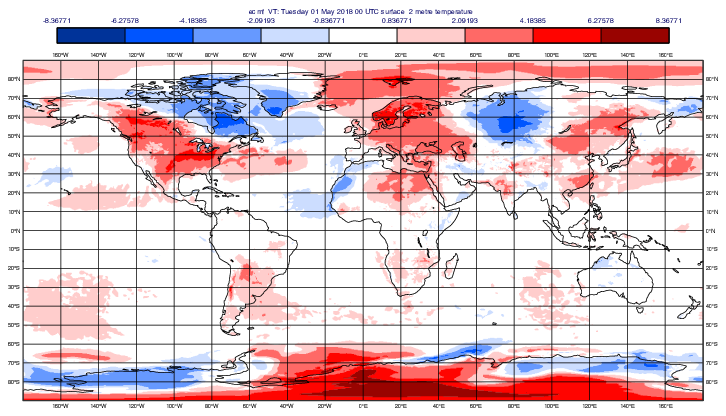
GRIB - Field Anomalies
# (C) Copyright 2017- ECMWF.
#
# This software is licensed under the terms of the Apache Licence Version 2.0
# which can be obtained at http://www.apache.org/licenses/LICENSE-2.0.
#
# In applying this licence, ECMWF does not waive the privileges and immunities
# granted to it by virtue of its status as an intergovernmental organisation
# nor does it submit to any jurisdiction.
#

# -------------------------------------------------------------------------
# Demonstrates how to plot anomalies from GRIB data (ERA5 here)
# -------------------------------------------------------------------------

import metview as mv

# read the GRIB data into a Fieldset
filename = "1month_anomaly_Global_ea_2t_201805_v02.grib"
if mv.exist(filename):
    diff = mv.read(filename)
else:
    diff = mv.gallery.load_dataset(filename)

# compute the absolute maximum value and compute a scale for the contouring
maxdiff = mv.maxvalue(abs(diff))
levels_relative = [-1, -0.75, -0.5, -0.25, -0.1, 0.1, 0.25, 0.5, 0.75, 1]
levels = [lev * maxdiff for lev in levels_relative]

# generate a contouring definition
# - we must set grib_scaling_of_retrieved_fields=off in order
# - to prevent scaling from K to C
diff_cont = mv.mcont(
    legend="on",
    contour="off",
    contour_level_selection_type="level_list",
    contour_level_list=levels,
    contour_shade="on",
    contour_shade_technique="grid_shading",
    contour_shade_colour_method="palette",
    contour_shade_palette_name="eccharts_blue_white_red_9",
    grib_scaling_of_retrieved_fields="off",
)

# increase font size in the legend (cm)
legend = mv.mlegend(legend_text_font_size=0.3)

# define the output plot file
mv.setoutput(mv.pdf_output(output_name="field_anomalies"))

# generate the plot
mv.plot(diff, diff_cont, legend)