mcont
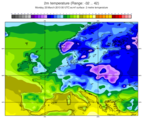
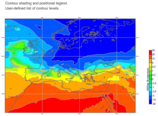
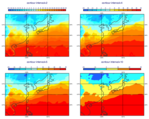
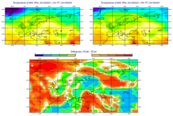
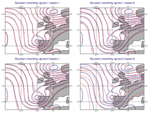
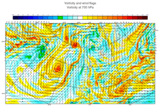
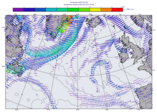
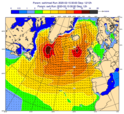
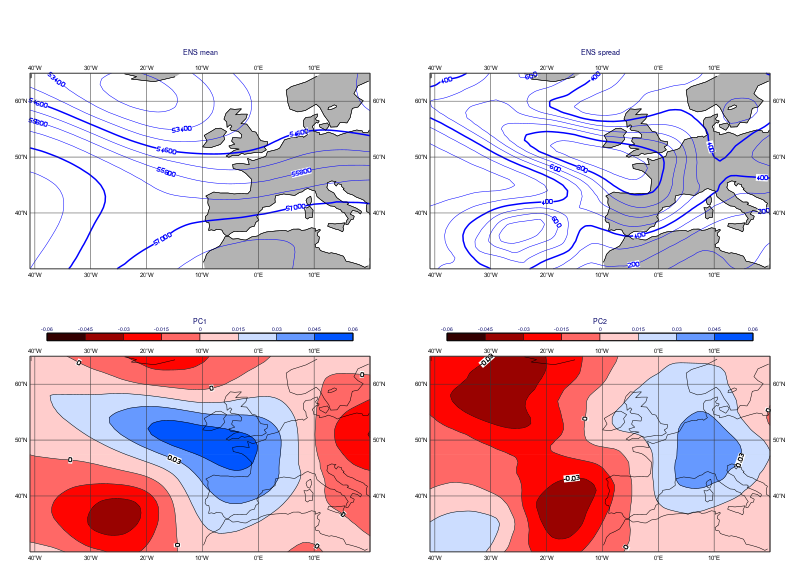
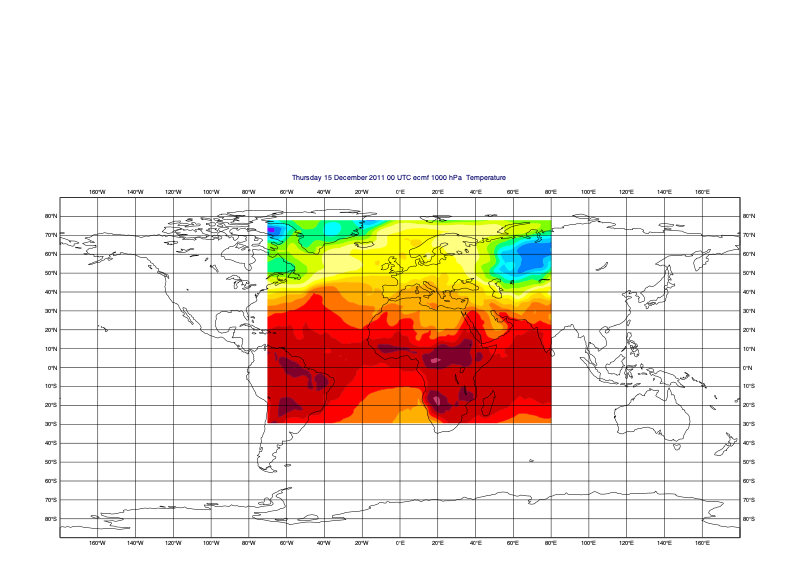
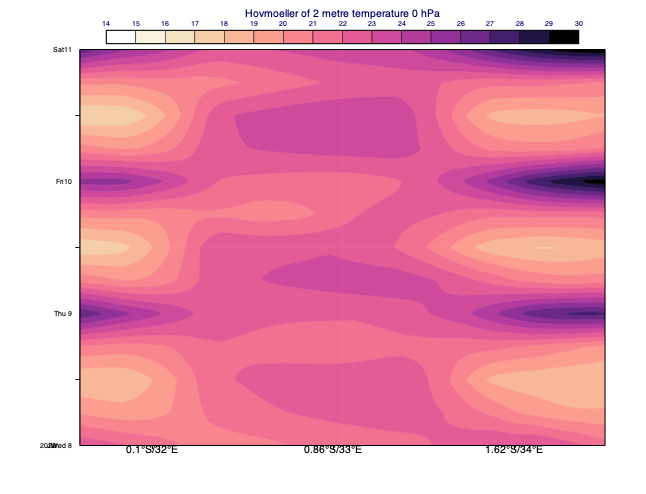
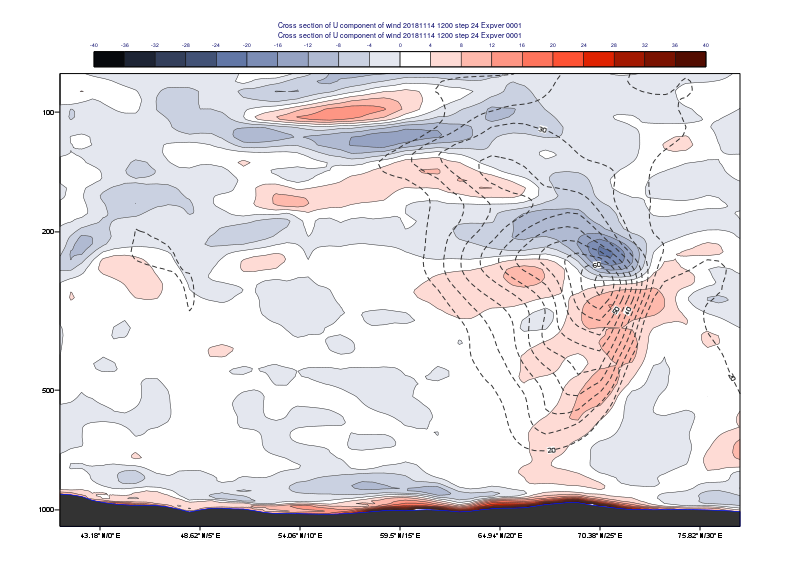
This is the visual definition for specifying how gridded data is displayed. It controls features such as isolines, shading, highs & lows, and grid value plotting.
Note
This function performs the same task as the Contouring icon in Metview’s user interface. It accepts its parameters as keyword arguments, described below.
- mcont(**kwargs)
Specifies the style for gridded data plotting.
- Parameters
contour_automatic_setting ({"off", "ecmwf", "style_name"}, default: "off") – Specifies the automatic contour settings mode. When it is set to “ecmwf” the default ecCharts style will be assigned to each GRIB field.
contour_style_name (str) – Specifies the predefined contour style name. Enabled when
contour_automatic_settingis “style_name”.legend ({"on", "off"}, default: "off") – Turns legend “on” or “off”.
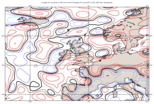
contour ({"on", "off"}, default: "on") – Turns contour lines “on” or “off”.
contour_line_style ({"solid", "dash", "dot", "chain_dot", "chain_dash"}, default: "solid") – Style of contour lines.
contour_line_thickness (number, default: 1) – Thickness of contour lines.
contour_line_colour_rainbow ({"on", "off"}, default: "off") – If it is set to “on”, rainbow colouring method will be used for contour lines.
contour_line_colour (str, default: "blue") – Colour of contour lines.
contour_line_colour_rainbow_method ({"calculate", "list"}, default: "calculate") – Method of generating the colours for individual isolines when
contour_line_colour_rainbowis “on”.contour_line_colour_rainbow_max_level_colour (str, default: "blue") – Colour to be used for the maximum isoline level when
contour_line_colour_rainbow_methodis “calculate”.contour_line_colour_rainbow_min_level_colour (str, default: "red") – Colour to be used for the minimum isoline level when
contour_line_colour_rainbow_methodis “calculate”.contour_line_colour_rainbow_direction ({"clockwise", "anti-clockwise"}, default: "anti-clockwise") – Direction of colour sampling along the colour wheel when
contour_line_colour_rainbow_methodis “calculate”.contour_line_colour_rainbow_colour_list (str or list[str]) – List of colours to be used for rainbow isolines when
contour_line_colour_rainbow_methodis “list”.contour_line_colour_rainbow_colour_list_policy ({"lastone", "cycle"}, default: "lastone") – Specifies what to do if there are fewer colour items in
contour_line_colour_rainbow_colour_listthan the number of contour values.contour_line_thickness_rainbow_list (number or list[number]) – List of thickness values to be used for rainbow isolines when
contour_line_colour_rainbow_methodis “list”.contour_line_thickness_rainbow_list_policy ({"lastone", "cycle"}, default: "lastone") – Specifies what to do if there are fewer thickness items in
contour_line_thickness_rainbow_listthan the number of contour values.contour_line_style_rainbow_list (str or list[str]) – List of line style items to be used for rainbow isolines when
contour_line_colour_rainbow_methodis “list”.contour_line_style_rainbow_list_policy ({"lastone", "cycle"}, default: "lastone") – Specifies what to do if there are fewer line style items in
contour_line_style_rainbow_listthan the number of contour values.contour_highlight ({"on", "off"}, default: "on") – Plot contour highlights.
contour_highlight_style ({"solid", "dash", "dot", "chain_dot", "chain_dash"}, default: "solid") – Style of contour highlighting.
contour_highlight_colour (str, default: "blue") – Colour of the highlighted contour lines.
contour_highlight_thickness (number, default: 3) – Thickness of the highlighted contour lines.
contour_highlight_frequency (number, default: 4) – Frequency of highlighted contour lines.
contour_reference_level (number, default: 0.0) – Specifies contour level from which the contour interval is calculated.
contour_level_selection_type ({"count", "interval", "level_list"}, default: "count") –
Specifies how the contour values are defined:
”count”: calculate a reasonable contour interval taking into account the min/max and the requested number of isolines. This is done separately for each individual fields!
”interval”: regularly spaced intervals using the
contour_reference_levelas base.”level_list”: uses the given
contour_level_list.
contour_max_level (number, default: 1.0e+21) – Highest level for contours to be drawn.
contour_min_level (number, default: -1.0e+21) – Lowest level for contours to be drawn.
contour_shade_max_level (number, default: 1.0e+21) – Highest level for contours to be shaded.
contour_shade_min_level (number, default: -1.0e+21) – Lowest level for contours to be shaded.
contour_level_list (number or list[number]) – List of contour levels to be plotted.
contour_interval (number, default: 8.0) – Interval in data units between two contour lines when
contour_level_selection_typeis “interval”.contour_level_count (number, default: 10) – Number of levels to be plotted when
contour_level_selection_typeis “count”. The plotting library will try to find a “nice” set of levels, which means that the number of levels could be slightly different than specified here.contour_level_tolerance (number, default: 2) – Do not use nice levels if the number of levels differs from
contour_level_countby more thancontour_level_tolerance.contour_label ({"on", "off"}, default: "on") – Plots labels on contour lines.
contour_label_type (str, default: "number") – Type of contour labels.
contour_label_text (str) – Text for contour labels.
contour_label_height (number, default: 0.3) – Height (cm) of contour labels.
contour_label_format (str, default: "(automatic)") – Format of contour labels.
contour_label_blanking ({"on", "off"}, default: "on") – Enables contour label blanking.
contour_label_font ({"arial", "courier", "helvetica", "times", "serif", "sansserif", "symbol"}, default: "sansserif") – The font type used for contour labels.
contour_label_font_style ({"normal", "bold", "italic", "bolditalic"}, default: "normal") – Style of the font used for contour labels.
contour_label_colour ({"background", "contour_line_colour"}, default: "contour_line_colour") – Colour of contour labels.
contour_label_frequency (number, default: 2) – Specifies the contour line frequency for contour labels. The labels will appear on every
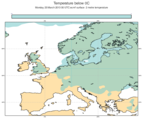
contour_label_frequencylines.contour_shade ({"on", "off"}, default: "off") – Enables contour shading.
contour_shade_technique ({"polygon_shading", "grid_shading", "cell_shading", "marker"}, default: "polygon_shading") – Specifies the technique used for shading.
contour_shade_colour_method ({"calculate", "list", "gradients", "palette"}, default: "calculate") – Method of generating the colours of the bands in contour shading.
contour_shade_method ({"area_fill", "dot", "hatch"}, default: "dot") – Rendering method used for contour shading.
contour_shade_cell_resolution (number, default: 10) – Number of cells per cm when
contour_shade_techniqueis “cell_shading”.contour_shade_cell_method ({"nearest", "interpolate"}, default: "nearest") – Method of determining the colour of a cell when
contour_shade_techniqueis “cell_shading”.contour_grid_shading_position ({"middle", "bottom_left"}, default: "middle") – When it is “middle” the point is in the middle of the cell, when it is “bottom_left”: the point is in the bottom left corner. Available when
contour_shade_techniqueis “grid_shading”.contour_shade_colour_table (str or list[str]) – Colour table to be used with marker shading technique. Available when
contour_shade_techniqueis “marker”.contour_shade_height_table (number or list[number]) – Height table to be used with marker shading technique. Available when
contour_shade_techniqueis “marker”.contour_shade_marker_table_type ({"index", "name"}, default: "index") – Specifies how the markers are specified when
contour_shade_techniqueis “marker”.contour_shade_marker_table (number or list[number]) – Marker table defined by a a set of numerical symbol identifiers when
contour_shade_marker_table_typeis “index”. The list of available symbol markers can be found here.contour_shade_marker_name_table (str or list[str]) – Marker table defined by a a set of symbol names when
contour_shade_marker_table_typeis “name”. The list of available symbol markers can be found here.contour_shade_max_level_colour (str, default: "blue") – Highest shading band colour.
contour_shade_min_level_colour (str, default: "red") – Lowest shading band colour.
contour_shade_colour_direction ({"clockwise", "anti_clockwise"}, default: "anti_clockwise") – Direction of colour sampling along the colour wheel for isoline shading when
contour_shade_colour_methodis “calculate”.contour_shade_colour_list (str or list[str]) – List of colours to be used in contour shading when
contour_shade_colour_methodis “list”.contour_gradients_colour_list (str or list[str]) – Colour used at the stops, the gradient will be calculated between 2 consecutive ones.
contour_gradients_waypoint_method ({"both", "ignore", "left", "right"}, default: "both") – Waypoints at the “left”, “right”, middle of the interval.
contour_gradients_technique ({"rgb", "hcl", "hsl"}, default: "rgb") – Technique to apply to compute the gradients.
contour_gradients_technique_direction ({"clockwise", "anti_clockwise", "shortest", "longest"}, default: "clockwise") – Technique to apply to compute the gradients.
contour_gradients_step_list (number or list[number], default: 10) – Number of steps to compute for each gradient interval.
contour_shade_palette_name (str) – The name of the colour palette to use when
contour_shade_colour_methodis “palette”.contour_shade_colour_list_policy ({"lastone", "cycle", "dynamic"}, default: "lastone") – Determine what to do if the list of colours in a palette or colour list is smaller/larger than the list of levels. When it is set to “dynamic” the required colours will be determined with interpolation. Used when
contour_shade_colour_methodis “palette” or “list”. New in Metview version 5.17.0contour_shade_colour_reverse_list ({"on", "off"}) – Reverse the list of colours in a palette or colour list. Used when
contour_shade_colour_methodis “palette” or “list”. New in Metview version 5.17.0contour_shade_dot_size (number, default: 0.02) – Size of dot in shading pattern when
contour_shade_methodis “dot”.contour_shade_max_level_density (number, default: 50.0) – Dots per square centimetre in highest shading band when
contour_shade_methodis “dot”.contour_shade_min_level_density (number, default: 1.0) – Dots per square centimetre in lowest shading band when
contour_shade_methodis “dot”.contour_shade_hatch_index (number, default: 0) – The hatching pattern(s) to use. 0 Provides an automatic sequence of patterns, other values set a constant pattern across all contour bands.
contour_shade_hatch_thickness (number, default: 1) – Thickness of hatch lines.
contour_shade_hatch_density (number, default: 18.0) – Number of hatch lines per cm.
contour_legend_text (str) – Text to be used in legend.
contour_method ({"automatic", "sample", "linear", "akima760", "akima474"}, default: "automatic") – Contouring method.
contour_akima_x_resolution (number, default: 1.5) – X resolution of Akima interpolation. Available when
contour_methodis “akima760” or “akima474”.contour_akima_y_resolution (number, default: 1.5) – Y resolution of Akima interpolation. Available when
contour_methodis “akima760” or “akima474”.contour_interpolation_floor (number, default: -1.0e21) – Any value below this floor will be forced to the floor value. Avoid the bubbles artificially created by the interpolation method.
contour_interpolation_ceiling (number, default: 1.0e21) – Any value above this ceiling will be forced to the ceiling value. Avoid the bubbles artificially created by the interpolation method.
contour_internal_reduction_factor (number, default: 4.0) – Internal factor for contouring. It is used in the shading/contouring algorithm to compute the size of the data matrix with respect to the size of the output (in internal units). The lower the value the higher the accuracy will be (but the contouring will be slower).
contour_threads ({"1", "4", "9"}, default: "4") – Number of threads used to optimise the contouring.
contour_hilo ({"on", "off", "hi", "lo"}, default: "off") – Plots local maxima/minima (highs/lows).
contour_hilo_type ({"text", "number", "both"}, default: "text") – Type of high/low value plotting.
contour_hi_text (str, default: "h") – Text to represent local maxima.
contour_lo_text (str, default: "l") – Text to represent local minima.
contour_hilo_blanking ({"on", "off"}, default: "off") – Blanking around high/low text.
contour_hilo_format (str, default: "(automatic)") – Format of high/low numbers.
contour_hilo_window_size (number, default: 3) – Size of the window used to calculate the high/low values.
contour_hilo_suppress_radius (number, default: 15.0) –
contour_hilo_max_value (number, default: 1.0e+21) – Local high/low values above the specified value are not drawn.
contour_hilo_min_value (number, default: -1.0e+21) – Local high/low values below the specified value are not drawn.
contour_hi_max_value (number, default: 1.0e+21) – Local high values above the specified value are not drawn.
contour_hi_min_value (number, default: -1.0e+21) – Local high values below the specified value are not drawn.
contour_lo_max_value (number, default: 1.0e+21) – Local low values above the specified value are not drawn.
contour_lo_min_value (number, default: -1.0e+21) – Local low values below the specified value are not drawn.
contour_hilo_marker ({"on", "off"}, default: "off") – Plot high/low markers.
contour_hilo_marker_height (number, default: 0.1) – Height (cm) of high/low marker symbols.
contour_hilo_marker_index (number, default: 3) – Index of high/low marker symbols.
contour_hilo_marker_colour (str, default: "red") – Colour of high/low marker symbols.
contour_hilo_height (number, default: 0.4) – Height of high/low text or numbers.
contour_hilo_quality ({"high", "medium", "low"}, default: "low") –
contour_hi_colour (str, default: "blue") – Colour of high values text or number.
contour_lo_colour (str, default: "blue") – Colour of low values text or number.
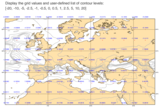
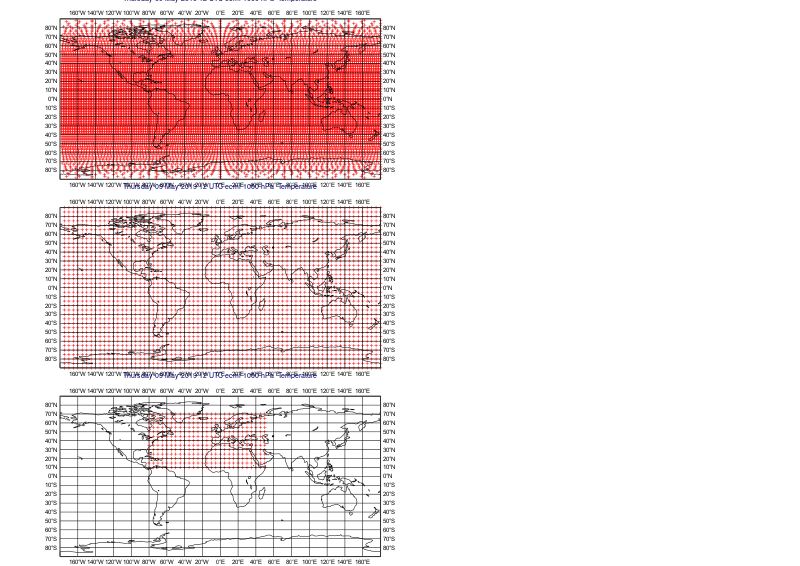
contour_grid_value_plot ({"on", "off"}, default: "off") – Plots grid point values.
contour_grid_value_type ({"normal", "reduced", "akima"}, default: "normal") –
contour_grid_value_plot_type ({"value", "marker", "both"}, default: "value") –
contour_grid_value_min (number, default: -1.0e+21) – The minimum value for which grid point values are to be plotted.
contour_grid_value_max (number, default: 1.0e+21) – The maximum value for which grid point values are to be plotted.
contour_grid_value_lat_frequency (number, default: 1) – The frequency of latitude rows for grid point value plotting.
contour_grid_value_lon_frequency (number, default: 1) – The frequency of longitude rows for grid point value plotting.
contour_grid_value_height (number, default: 0.25) – Height of the grid point values.
contour_grid_value_colour (str, default: "blue") – Colour of the grid point values.
contour_grid_value_format (str, default: "(automatic)") – Format of the grid point values.
contour_grid_value_quality ({"high", "medium", "low"}, default: "low") –
contour_grid_value_position ({"top", "bottom", "left", "right"}, default: "top") – Specifies the position of the values. Only works when
contour_grid_value_plot_typeis “both”.contour_grid_value_justification ({"centre", "left", "right"}, default: "centre") – Specifies the horizontal position of the grid values. Only works when
contour_grid_value_plot_typeis “value”.contour_grid_value_vertical_align ({"normal", "top", "cap", "half", "base", "bottom"}, default: "base") – Specifies the vertical position of the grid values. Only works when
contour_grid_value_plot_typeis “value”.contour_grid_value_marker_height (number, default: 0.25) – Height of the grid point markers.
contour_grid_value_marker_colour (str, default: "red") – Colour of the grid point markers.
contour_grid_value_marker_qual ({"high", "medium", "low"}, default: "low") – Quality of the grid point marker.
contour_grid_value_marker_index (number, default: 3) – Index of marker symbol for grid point plotting.
grib_scaling_of_retrieved_fields ({"on", "off"}, default: "on") – Toggles the contour scaling from SI units to more convenient units for retrieved fields. In Metview a GRIB field is regarded as “retrieved” if the value of the generatingProcessIdentifier ecCodes key is not 254 in the GRIB header (otherwise the field is regarded as “derived”). GRIB data retrieved from MARS are always identified as “retrieved”. The contour scaling involves conversion e.g. from K to Celsius, Pa to hPa for the most common parameters. The parameters involved in contour scaling and the type of scaling are defined by Metview’s plotting library (Magics).
grib_scaling_of_derived_fields ({"on", "off"}, default: "off") –
Toggles the contour scaling from SI units to more convenient units for derived GRIB fields. In Metview a GRIB field is regarded as “derived” if the generatingProcessIdentifier ecCodes key is set to 254 in the GRIB header (otherwise the field is regarded as “retrieved”). Most of the Metview computations will set this key accordingly marking the resulting fields as “derived”. Please be careful with this option since you do not want to perform the contour scaling after some computations. Here are a few examples:
when computing the mean temperature, if we want to plot it in Celsius units (instead of K) we need to set
grib_scaling_of_derived_fieldsto “on”when computing the difference between temperature fields we do not want any contour scaling since the difference in K is the same as the difference in Celsius. So
grib_scaling_of_derived_fieldsshould be “off”.when computing the difference between accumulated precipitation fields, if we want to plot the results in mm units (instead of m) we need to set
grib_scaling_of_derived_fieldsto “on”
grib_interpolation_method ({"interpolate", "nearest", "nearest_valid"}, default: "interpolate") – Internal interpolation method used for the contouring algorithm.
grib_interpolation_method_missing_fill_count (number, default: 1) –
grib_interpolation_regular_resolution (number, default: 0.1) – Sets the plotting resolution, in degrees, of GRIB fields encoded in space_view projection. The default is 0.1.
contour_sample_x_interval (number, default: 2) –
contour_sample_y_interval (number, default: 2) –
- Return type
Request

