Note
Click here to download the full example code
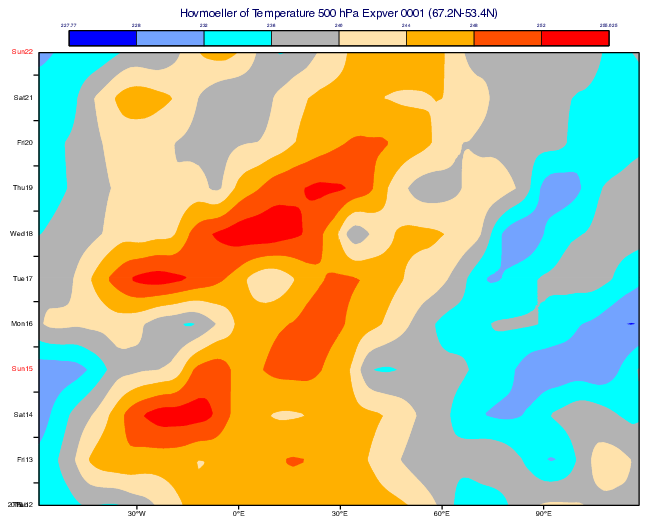
GRIB - Hovmoeller Area Average
# (C) Copyright 2017- ECMWF.
#
# This software is licensed under the terms of the Apache Licence Version 2.0
# which can be obtained at http://www.apache.org/licenses/LICENSE-2.0.
#
# In applying this licence, ECMWF does not waive the privileges and immunities
# granted to it by virtue of its status as an intergovernmental organisation
# nor does it submit to any jurisdiction.
#

# ----------------------------------------------------------------------
# Demonstrates how to use a Hovmoeller View to
# compute and plot an area average over time from GRIB data
# ----------------------------------------------------------------------

import metview as mv

# read the GRIB data from file
filename = "t_ts.grib"
if mv.exist(filename):
    t_ts = mv.read(filename)
else:
    t_ts = mv.gallery.load_dataset(filename)

# set up the view to plot the data into
# we will compute the average value along North/South lines over the
# given area. We also supply a custom Time Axis definition in order
# to increase the size of the date labels

time_axis = mv.maxis(
    axis_type="date",
    axis_years_label_height=0.3,
    axis_months_label_height=0.3,
    axis_days_label_height=0.3,
)

hovmoeller_view = mv.mhovmoellerview(
    type="area_hovm",
    area=[53.4, -58.9, 67.2, 118.1],
    average_direction="north_south",
    time_axis=time_axis,
)

# set up the contouring style
shade = mv.mcont(
    legend="on",
    contour="off",
    contour_level_count=8,
    contour_label="off",
    contour_shade="on",
    contour_shade_colour_method="list",
    contour_shade_method="area_fill",
    contour_shade_colour_list=[
        "blue",
        "sky",
        "blue_green",
        "grey",
        "cream",
        "yellowish_orange",
        "reddish_orange",
        "red",
    ],
)

# set up the title, just to make the font bigger
title = mv.mtext(text_font_size=0.5)

# define the output plot file
mv.setoutput(mv.pdf_output(output_name="hovmoeller_area"))

# plot the data into the Hovmoeller view with visdefs for styling
mv.plot(hovmoeller_view, t_ts, shade, title)