Note
Click here to download the full example code
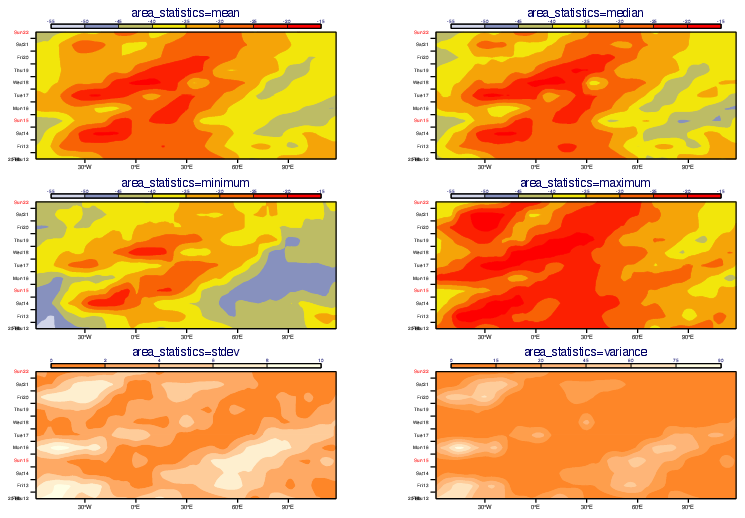
GRIB - Hovmoeller Area Statistics
# (C) Copyright 2017- ECMWF.
#
# This software is licensed under the terms of the Apache Licence Version 2.0
# which can be obtained at http://www.apache.org/licenses/LICENSE-2.0.
#
# In applying this licence, ECMWF does not waive the privileges and immunities
# granted to it by virtue of its status as an intergovernmental organisation
# nor does it submit to any jurisdiction.
#

import metview as mv

# read  GRIB data
filename = "t_ts.grib"
if mv.exist(filename):
    t_ts = mv.read(filename)
else:
    t_ts = mv.gallery.load_dataset(filename)

# convert values K -> C
t_ts = t_ts - 273.16

# temperature contours
shade_t = mv.mcont(
    legend                           = "on",
    contour                          = "off",
    contour_level_selection_type     = "interval",
    contour_max_level                = -15,
    contour_min_level                = -55,
    contour_interval                 = 5,
    contour_label                    = "off",
    contour_shade                    = "on",
    contour_shade_colour_method      = "palette",
    contour_shade_method             = "area_fill",
    contour_shade_palette_name       = "eccharts_purple_red_14",
    contour_shade_colour_list_policy = "dynamic"
    )

# stdev contours
shade_std = mv.mcont(
    legend                            = "on",
    contour                           = "off",
    contour_level_selection_type      = "interval",
    contour_max_level                 = 10,
    contour_min_level                 = 0,
    contour_interval                  = 2,
    contour_label                     = "off",
    contour_shade                     = "on",
    contour_shade_colour_method       = "palette",
    contour_shade_method              = "area_fill",
    contour_shade_palette_name        = "norway_orange_7",
    contour_shade_colour_list_policy  = "dynamic",
    contour_shade_colour_reverse_list = "on"
    )

# variance contours
shade_var = mv.mcont(
    legend                            = "on",
    contour                           = "off",
    contour_level_selection_type      = "interval",
    contour_max_level                 = 90,
    contour_min_level                 = 0,
    contour_interval                  = 15,
    contour_label                     = "off",
    contour_shade                     = "on",
    contour_shade_colour_method       = "palette",
    contour_shade_method              = "area_fill",
    contour_shade_palette_name        = "norway_orange_7",
    contour_shade_colour_list_policy  = "dynamic",
    contour_shade_colour_reverse_list = "on"
    )

# define time axis
time_axis = mv.maxis(
        axis_type="date",
        axis_years_label_height=0.2,
        axis_months_label_height=0.2,
        axis_days_label_height=0.2,
    )

# define geo axis
geo_axis = mv.maxis(
    axis_tick_label_type   = "latitude",
    axis_tick_label_height = 0.25
    )

# build graphical contents
stats = ["mean", "median", "minimum", "maximum", "stdev", "variance"]
shades = [shade_t, shade_t,shade_t,shade_t,shade_std,shade_var]

gr = []
for i, act_stats in enumerate(stats):

    # define North-South area hovmoeller view with various area statistics
    view = mv.mhovmoellerview(
        type="area_hovm",
        area=[67.2, -58.9, 53.4, 118.1],
        area_statistics=act_stats,
        average_direction="north_south",
        time_axis=time_axis,
        geo_axis=geo_axis
    )

    # define title
    title = mv.mtext(text_lines="area_statistics=" + act_stats, text_font_size=0.5)

    # build graphical contents
    gr.append([view, t_ts, shades[i], title])


# create a 3x2 plot layout with the defined views
pages = []
x = [0,50,0,50,0,50]
y = [5,5,35,35,65,65]
w = 50
h = 28
for i in range(6):
    pages.append(mv.plot_page(top=y[i], bottom=y[i]+h, left=x[i], right=x[i]+w, view=gr[i][0]))

dw = mv.plot_superpage(page=pages)

# define the output plot file
mv.setoutput(mv.pdf_output(output_name="hovmoeller_stats"))

# generate plot
g = []
for i in range(6):
    g.extend([dw[i], *(gr[i])])

mv.plot(g)