Note
Click here to download the full example code
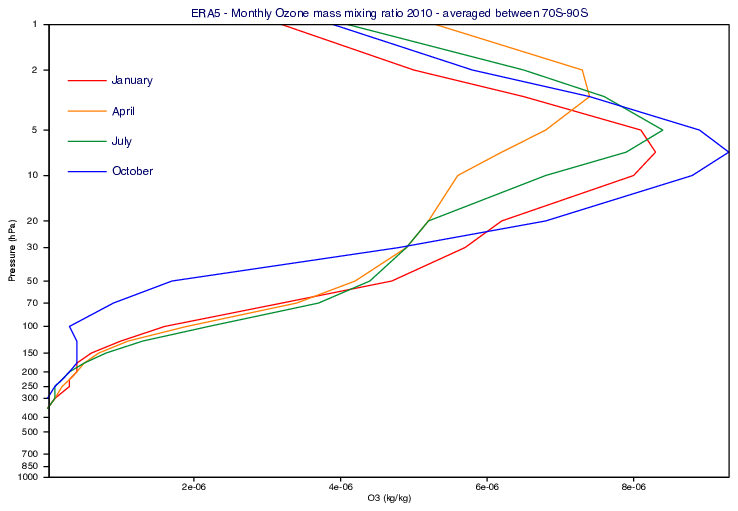
GRIB - ERA5 Ozone Profile
# (C) Copyright 2017- ECMWF.
#
# This software is licensed under the terms of the Apache Licence Version 2.0
# which can be obtained at http://www.apache.org/licenses/LICENSE-2.0.
#
# In applying this licence, ECMWF does not waive the privileges and immunities
# granted to it by virtue of its status as an intergovernmental organisation
# nor does it submit to any jurisdiction.
#

import metview as mv

# getting data
use_cds = False

filename = "o3_era5_2010_south.grib"

# getting forecast data from CDS
if use_cds:
    import cdsapi

    c = cdsapi.Client()
    c.retrieve(
        "reanalysis-era5-pressure-levels-monthly-means",
        {
            "format": "grib",
            "product_type": "monthly_averaged_reanalysis",
            "variable": "ozone_mass_mixing_ratio",
            "pressure_level": [
                "1",
                "2",
                "3",
                "5",
                "7",
                "10",
                "20",
                "30",
                "50",
                "70",
                "100",
                "125",
                "150",
                "175",
                "200",
                "225",
                "250",
                "300",
                "350",
                "400",
                "450",
                "500",
                "550",
                "600",
                "650",
                "700",
                "750",
                "775",
                "800",
                "825",
                "850",
                "875",
                "900",
                "925",
                "950",
                "975",
                "1000",
            ],
            "year": "2010",
            "month": [
                "01",
                "04",
                "07",
                "10",
            ],
            "time": "00:00",
            "area": [
                -60,
                -180,
                -90,
                180,
            ],
            "grid": [1, 1],
        },
        filename,
    )

    g = mv.read(filename)
# read data from file
else:
    if mv.exist(filename):
        g = mv.read(filename)
    else:
        g = mv.gallery.load_dataset(filename)

# define horizontal axis
horizontal_axis = mv.maxis(
    axis_orientation="horizontal",
    axis_tick_label_height=0.4,
    axis_title_text="O3 (kg/kg)",
)

# define vertical axis
vertical_axis = mv.maxis(
    axis_orientation="vertical",
    axis_type="position_list",
    axis_tick_position_list=[
        1000,
        850,
        700,
        500,
        400,
        300,
        250,
        200,
        150,
        100,
        70,
        50,
        20,
        30,
        10,
        5,
        2,
        1,
    ],
    axis_tick_label_height=0.4,
    axis_title_text="Pressure (hPa)",
)

# define vertical profile view with averaging over the area between 70S-90S
view = mv.mvertprofview(
    input_mode="area",
    area=[-70, -180, -90, 180],
    bottom_level=1000,
    top_level=1,
    vertical_scaling="log",
    value_axis=horizontal_axis,
    level_axis=vertical_axis,
)

# extract grib data for each month and build curve objects for plotting
month_def = {"01": "red", "04": "orange", "07": "kelly_green", "10": "blue"}
p_def = []
legend_def = []
for m, col in month_def.items():
    date = f"2010{m}01"
    f = mv.read(data=g, date=date)
    p_def.extend(
        [
            f,
            mv.mgraph(
                legend="on",
                graph_type="curve",
                graph_line_colour=col,
                graph_line_thickness=2,
            ),
        ]
    )
    legend_def.append(mv.date(date).strftime("%B"))

# define legend
legend = mv.mlegend(
    legend_display_type="disjoint",
    legend_entry_plot_direction="column",
    legend_text_composition="user_text_only",
    legend_entry_plot_orientation="top_bottom",
    legend_border_colour="black",
    legend_box_mode="positional",
    legend_box_x_position=2.5,
    legend_box_y_position=12,
    legend_box_x_length=5,
    legend_box_y_length=5,
    legend_text_font_size=0.5,
    legend_user_lines=legend_def,
)

# define title
title = mv.mtext(
    text_lines="ERA5 - Monthly Ozone mass mixing ratio 2010 - averaged between 70S-90S",
    text_font_size=0.5,
)

# define the output plot file
mv.setoutput(mv.pdf_output(output_name="ozone_era5_profile"))

# generate plot
mv.plot(view, p_def, title, legend)