mgraph
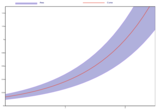
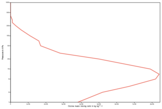
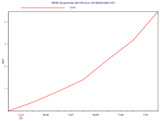
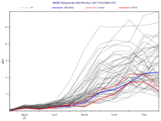
This is the visual definition responsible for specifying how graph data (e.g. lines, curves and bar charts) are displayed.
Note
The list of available symbol markers can be found here.
Note
This function performs the same task as the Graph Plotting icon in Metview’s user interface. It accepts its parameters as keyword arguments, described below.
- mgraph(**kwargs)
Specifies the style for graph plotting.
- Parameters
legend ({"on", "off"}, default: "off") – Enables the legend.
legend_user_text (str) – User-defined text for the legend.
graph_type ({"curve", "bar", "flag", "arrow", "area"}, default: "curve") – Defines the type of curve required.
graph_shade ({"on", "off"}, default: "on") – Turns the shading on when
graph_typeis “bar” or “area”.graph_line ({"on", "off"}, default: "on") – Plots the curve line.
graph_line_style ({"solid", "dash", "dot", "chain_dot", "chain_dash"}, default: "solid") – Line style of the curve.
graph_line_colour (str, default: "blue") – Colour of the curve.
graph_line_thickness (number, default: 1) – Thickness of the curve.
graph_symbol ({"on", "off"}, default: "off") – Specifies if symbols are to be drawn along the curves at waypoints.
graph_symbol_marker_index (number, default: 3) – The marker symbol index to be used. The list of available symbol markers can be found here.
graph_symbol_height (number, default: 0.2) – Height of the marker symbol.
graph_symbol_colour (str, default: "red") – Colour of the marker symbol.
graph_symbol_outline ({"on", "off"}, default: "off") – Adds outline marker symbols.
graph_symbol_outline_colour (str, default: "black") – Colour of the marker symbol outline.
graph_symbol_outline_thickness (number, default: 1) – Thickness of the marker symbol outline.
graph_symbol_outline_style ({"solid", "dash", "dot", "chain_dot", "chain_dash"}, default: "solid") – Line style of the marker symbol outline.
graph_x_suppress_below (number, default: -1.0e+21) – x coordinate below which a point is considered missing.
graph_x_suppress_above (number, default: 1.0e+21) – x coordinate above which a point is considered missing.
graph_y_suppress_below (number, default: -1.0e+21) – y coordinate below which a point is considered missing.
graph_y_suppress_above (number, default: 1.0e+21) – y coordinate above which a point is considered missing.
graph_missing_data_mode ({"ignore", "join", "drop"}, default: "ignore") – Specifies the method to handle missing data.
graph_missing_data_style ({"solid", "dash", "dot", "chain_dot", "chain_dash"}, default: "dash") – Line style of the missing data part of curve.
graph_missing_data_colour (str, default: "red") – Colour of the missing data part of curve.
graph_missing_data_thickness (number, default: 1) – Thickness of the missing data part of curve.
graph_flag_colour (str, default: "black") – The colour of the flags.
graph_flag_length (number, default: 0.75) – Physical length (in cm) of wind flag shaft.
graph_arrow_colour (str, default: "black") – The colour of the arrows.
graph_arrow_unit_velocity (number, default: 25.0) – Wind speed in m/s represented by a unit vector (1.0 cm) when
graph_typeis “arrow”.graph_bar_orientation ({"vertical", "horizontal"}, default: "vertical") – Orientation of the bars
graph_typeis “bar”.graph_bar_justification ({"left", "centre", "right"}, default: "centre") – The bars will be centred on the value, or left, right justified. Useful for plotting any accumulated fields.
graph_bar_width (number, default: -1) – The width of a bar in a bar chart.
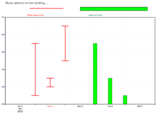
graph_bar_style ({"bar", "linebar"}, default: "bar") – If it is set to “linebar”, a line will be drawn at the position with 2 small perpendicular lines at top and bottom.
graph_bar_line_style ({"solid", "dash", "dot", "chain_dot", "chain_dash"}, default: "solid") – Line style of the bar outline.
graph_bar_line_thickness (number, default: 1) – Thickness of the bar outline.
graph_bar_line_colour (str, default: "black") – The colour of the bar outline.
graph_bar_colour (str, default: "blue") – The colour of the interiors of bars.
graph_bar_clipping ({"on", "off"}, default: "on") – Whether or not to clip the bars if they go outside the view area.
graph_bar_annotation (str or list[str]) – Text annotations on the top of the bars.
graph_bar_annotation_font_size (number, default: 0.25) – Font size for bar annotation.
graph_bar_annotation_font_colour (str, default: "red") – Font colour for bar annotation.
graph_bar_minimum_value (number, default: 1.0e21) – If set, defines the bottom of the bar.
graph_shade_style ({"area_fill", "hatch", "dot"}, default: "area_fill") – Style of shading.
graph_shade_colour (str, default: "blue") – The colour of the shaded part of bars.
graph_shade_dot_density (number, default: 20) – Density per square cm of shading dots.
graph_shade_dot_size (number, default: 0.02) – Size of shading dots.
graph_shade_hatch_index (number, default: 0) – Hatch index number.
- Return type
Request

