Note
Click here to download the full example code
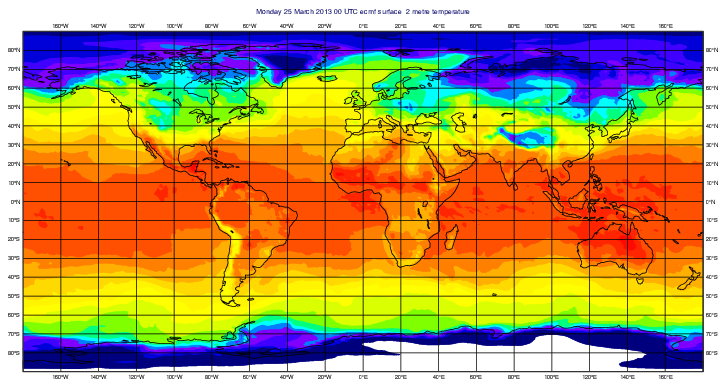
GRIB - 2m Temperature with ecCharts Style
# (C) Copyright 2017- ECMWF.
#
# This software is licensed under the terms of the Apache Licence Version 2.0
# which can be obtained at http://www.apache.org/licenses/LICENSE-2.0.
#
# In applying this licence, ECMWF does not waive the privileges and immunities
# granted to it by virtue of its status as an intergovernmental organisation
# nor does it submit to any jurisdiction.
#

import metview as mv

# read the data from a GRIB file
filename = "2m_temperature.grib"
if mv.exist(filename):
    data = mv.read(filename)
else:
    data = mv.gallery.load_dataset(filename)

# use the automatic ecCharts style for contouring
contours = mv.mcont(contour_automatic_setting="ecchart")

# define the output plot file
mv.setoutput(mv.pdf_output(output_name="plot_t2m"))

# plot the data with the style
mv.plot(data, contours)