Note
Click here to download the full example code
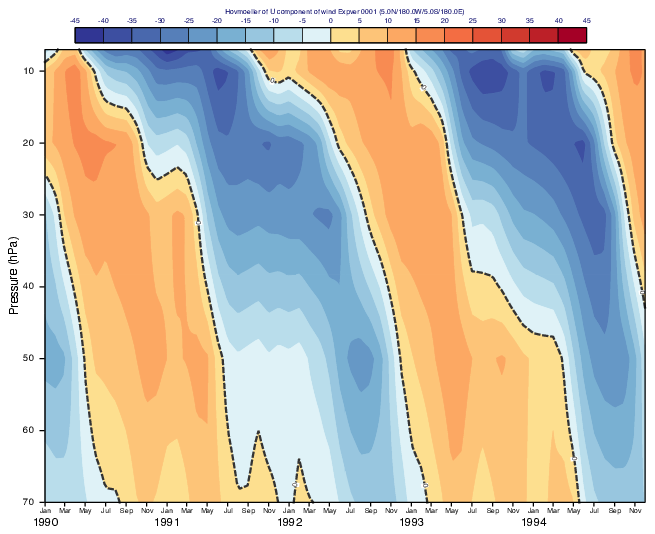
GRIB - ERA5 Quasi Biennial Oscillation on Vertical Hovmoeller
# (C) Copyright 2017- ECMWF.
#
# This software is licensed under the terms of the Apache Licence Version 2.0
# which can be obtained at http://www.apache.org/licenses/LICENSE-2.0.
#
# In applying this licence, ECMWF does not waive the privileges and immunities
# granted to it by virtue of its status as an intergovernmental organisation
# nor does it submit to any jurisdiction.
#

import metview as mv

# getting data
use_cds = False

filename = "u_era5_mnth_strato.grib"

# getting forecast data from CDS
if use_cds:
    import cdsapi

    c = cdsapi.Client()
    c.retrieve(
        "reanalysis-era5-pressure-levels-monthly-means",
        {
            "product_type": "monthly_averaged_reanalysis",
            "variable": "u_component_of_wind",
            "pressure_level": [70, 50, 30, 20, 10, 7],
            "year": [1990, 1991, 1992, 1993, 1994],
            "month": list(range(13)),
            "day": "01",
            "time": "00:00",
            "area": [30, -180, -30, 180],
            "grid": [1, 1],
            "format": "grib",
        },
        filename,
    )
    g = mv.read(filename)
# read data from file
else:
    if mv.exist(filename):
        g = mv.read(filename)
    else:
        g = mv.gallery.load_dataset(filename)

# define time axis
time_axis = mv.maxis(
    axis_type="date",
    axis_date_type="months",
    axis_years_label_quality="high",
    axis_years_label_height=0.5,
    axis_months_label_quality="high",
    axis_months_label_height=0.3,
    axis_days_label="off",
)

# define vertical axis
vertical_axis = mv.maxis(
    axis_tick_label_height=0.4, axis_title_text="Pressure (hPa)", axis_title_height=0.5
)

# define view
view = mv.mhovmoellerview(
    type="vertical_hovm",
    area=[5, -180, -5, 180],  # N,W,S,E
    bottom_level=70,
    top_level=7,
    time_axis=time_axis,
    vertical_axis=vertical_axis,
)

# define contour shading
cont_shade = mv.mcont(
    legend="on",
    contour="off",
    contour_level_selection_type="interval",
    contour_shade_max_level=45,
    contour_shade_min_level=-45,
    contour_interval=5,
    contour_label="off",
    contour_shade="on",
    contour_shade_colour_method="palette",
    contour_shade_method="area_fill",
    contour_shade_palette_name="colorbrewer_RdYlBu_18",
)


# define contouring for zero isoline
cont_zero = mv.mcont(
    contour_line_style="dash",
    contour_line_thickness=4,
    contour_line_colour="charcoal",
    contour_highlight="off",
    contour_max_level=0,
    contour_min_level=0,
)

# define legend
legend = mv.mlegend(legend_text_font_size=0.3)

# define the output plot file
mv.setoutput(mv.pdf_output(output_name="qbo_era5_vertical_hovmoeller"))

# generate plot
mv.plot(view, g, cont_shade, cont_zero, legend)