Note
Click here to download the full example code
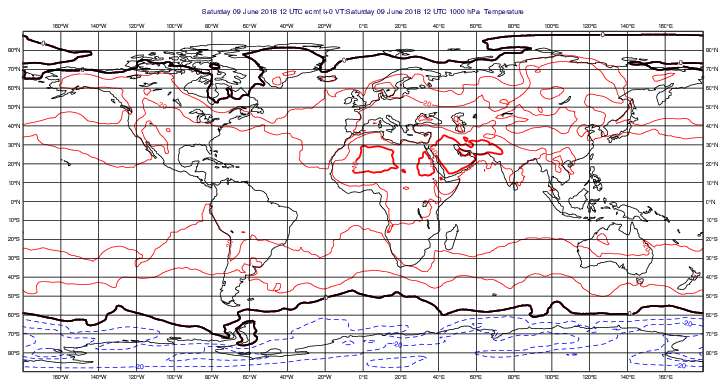
GRIB - Split contouring
# (C) Copyright 2017- ECMWF.
#
# This software is licensed under the terms of the Apache Licence Version 2.0
# which can be obtained at http://www.apache.org/licenses/LICENSE-2.0.
#
# In applying this licence, ECMWF does not waive the privileges and immunities
# granted to it by virtue of its status as an intergovernmental organisation
# nor does it submit to any jurisdiction.
#

import metview as mv

# ---------------------------------------------------------------
# Demonstrates one way to emulate Metview 3's split
# contouring facility using multiple Contouring
# definitions in later Metview versions
# ---------------------------------------------------------------

use_mars = False
if use_mars:
    # Retrieve data from MARS
    data = mv.retrieve(param="t", levelist=1000, grid=[1.5, 1.5], date=-10)
else:
    filename = "t1000.grib"
    if mv.exist(filename):
        data = mv.read(filename)
    else:
        data = mv.gallery.load_dataset(filename)

split_below = mv.mcont(
    contour_line_style="dash",
    contour_highlight_style="dash",
    contour_max_level=0,
    contour_level_count=5,
)

split_above = mv.mcont(
    contour_line_colour="red",
    contour_highlight_colour="red",
    contour_min_level=0,
    contour_level_count=5,
)

split_on = mv.mcont(
    contour_line_thickness=3,
    contour_line_colour="black",
    contour_highlight="off",
    contour_max_level=0,
    contour_min_level=0,
)

# define the output plot file
mv.setoutput(mv.pdf_output(output_name="split_contour"))

# plot the data onto the map
mv.plot(data, split_below, split_above, split_on)