Note
Click here to download the full example code
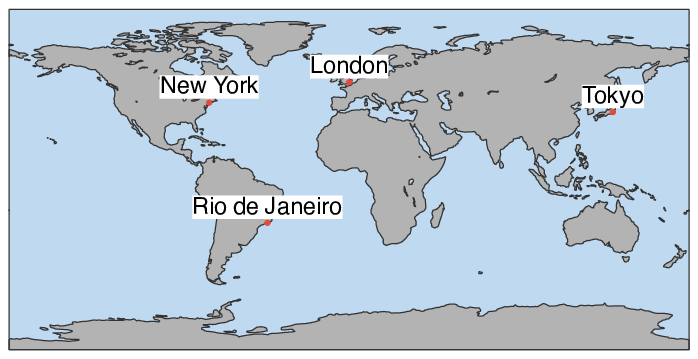
Geopoints - Plot Text Labels at Geopoints Locations
# (C) Copyright 2017- ECMWF.
#
# This software is licensed under the terms of the Apache Licence Version 2.0
# which can be obtained at http://www.apache.org/licenses/LICENSE-2.0.
#
# In applying this licence, ECMWF does not waive the privileges and immunities
# granted to it by virtue of its status as an intergovernmental organisation
# nor does it submit to any jurisdiction.
#

import metview as mv

# read geopoints containing 4 city locations
filename = "city_loc.gpt"
if mv.exist(filename):
    gpt = mv.read(filename)
else:
    gpt = mv.gallery.load_dataset(filename)

# define text labels
# - the geopoints have values of 1, 2, 3 and 4
txt_lst = ["London", "New York", "Rio de Janeiro", "Tokyo"]

# define text plotting
# the first interval is 1(inclusive)->2(exclusive), etc
sym_txt = mv.msymb(
    legend="off",
    symbol_type                          = "text",
    symbol_table_mode                    = "advanced",
    symbol_advanced_table_selection_type = "list",
    symbol_advanced_table_level_list     = [1, 2, 3, 4, 5],
    symbol_advanced_table_text_list      = txt_lst,
    symbol_advanced_table_text_font_size = 1,
    symbol_advanced_table_text_display_type = "top",
    symbol_text_blanking                 = "on", #  requires Magics >=4.8.1
    )

# define location plotting
sym_loc = mv.msymb(
    legend="off",
    symbol_type="marker",
    symbol_colour="coral",
    symbol_height=0.4,
    symbol_marker_index=15,
)

# define coastlines
coast = mv.mcoast(
    map_coastline_colour="charcoal",
    map_coastline_thickness=2,
    map_coastline_land_shade="on",
    map_coastline_land_shade_colour="grey",
    map_coastline_sea_shade="on",
    map_coastline_sea_shade_colour="RGB(0.7475,0.8504,0.9466)",
    map_grid="off",
    map_label="off",
    map_layer_mode="background",
)

# define the output plot file
mv.setoutput(mv.pdf_output(output_name="text_at_geopoints_locations"))

# generate plot
mv.plot(coast, gpt, sym_txt, sym_loc)