mcoast

This is the visual definition for specifying how a map is displayed in a geoview(). It controls features such as coastlines, land and sea shading and grid lines.
Note
This function performs the same task as the Coastlines icon in Metview’s user interface. It accepts its parameters as keyword arguments, described below.
- mcoast(**kwargs)
Specifies the map style for a
geoview().- Parameters
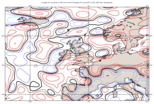
map_coastline ({"on", "off"}, default: "on") – Plot coastlines onto the map.
map_coastline_colour (str, default: "black") – Colour of coastlines.
map_coastline_style ({"solid", "dash", "dot", "chain_dot", "chain_dash"}, default: "solid") – Line style of coastlines.
map_coastline_thickness (number, default: 1) – Line thickness of coastlines.
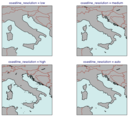
map_coastline_resolution ({"automatic", "low", "medium", "high", "full"}, default: "automatic") – Select one of the pre-defined resolutions. When set to “automatic”, a resolution appropriate to the scale of the map is chosen in order to balance quality with speed.
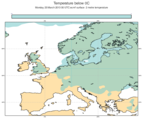
map_coastline_land_shade ({"on", "off"}, default: "off") – Sets if land areas are shaded.
map_coastline_land_shade_colour (str, default: "green") – Colour of shading of land areas.
map_coastline_sea_shade ({"on", "off"}, default: "off") – Sets if sea areas are shaded.
map_coastline_sea_shade_colour (str, default: "blue") – Colour of shading of sea areas.
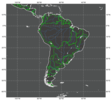
map_rivers ({"on", "off"}, default: "off") – Plots rivers.
map_rivers_style ({"solid", "dash", "dot", "chain_dot", "chain_dash"}, default: "solid") – Line style for rivers.
map_rivers_colour (str, default: "blue") – Colour of the rivers.
map_rivers_thickness (number, default: 1) – Line thickness of the rivers.
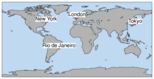
map_cities ({"on", "off"}, default: "off") – Plots cities (capitals only).
map_cities_font_name ({"arial", "courier", "helvetica", "times", "serif", "sansserif", "symbol"}, default: "sansserif") – Defines the font type for cities.
map_cities_font_style ({"normal", "bold", "italic", "bolditalic"}, default: "normal") – Defines the font style for cities.
map_cities_font_size (number, default: 2.5) – Font size of city names.
map_cities_unit_system ({"percent", "cm"}, default: "percent") – Units for
map_cities_font_size.map_cities_font_colour (str, default: "navy") – Colour used for city names.
map_cities_text_blanking ({"on", "off"}, default: "on") – Use blanking when plotting the city names.
map_cities_name_position ({"above", "below", "left", "right"}, default: "above") – Position where to display the city names around their locations.
map_cities_marker ({"circle", "box", "snowflake", "plus"}, default: "plus") – Defines marker for cities.
map_cities_marker_height (number, default: 0.7) – Height of
map_cities_marker.map_cities_marker_colour (str, default: "evergreen") – Colour for
map_cities_marker.map_boundaries ({"on", "off"}, default: "off") – Plots political boundaries.
map_boundaries_style ({"solid", "dash", "dot", "chain_dot", "chain_dash"}, default: "solid") – Line style of map boundaries.
map_boundaries_colour (str, default: "grey") – Colour of map boundaries.
map_boundaries_thickness (number, default: 1) – Line thickness of map boundaries.
map_disputed_boundaries ({"on", "off"}, default: "on") – Plot disputed boundaries onto the map. It can only be enabled when
map_boundariesis on.map_disputed_boundaries_style ({"solid", "dash", "dot", "chain_dot", "chain_dash"}, default: "dash") – Line style of disputed boundaries.
map_disputed_boundaries_colour (str, default: "automatic") – Colour of disputed boundaries.
map_disputed_boundaries_thickness (number, default: 1) – Line thickness of disputed boundaries.
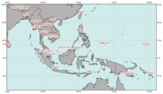
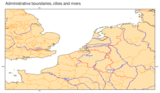
map_administrative_boundaries ({"on", "off"}, default: "off") – Plots administrative boundaries into the map. It can only be enabled when
map_boundariesis on.map_administrative_boundaries_countries_list (str or list[str]) – List of countries whose administrative boundaries will be plotted.
map_administrative_boundaries_style ({"solid", "dash", "dot", "chain_dot", "chain_dash"}, default: "dash") – Line style for administrative boundaries.
map_administrative_boundaries_colour (str, default: "automatic") – Colour of administrative boundaries.
map_administrative_boundaries_thickness (number, default: 1) – Line thickness of administrative boundaries.
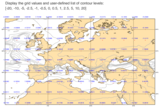
map_grid ({"on", "off"}, default: "on") – Plots grid lines onto the map.
map_grid_line_style ({"solid", "dash", "dot", "chain_dot", "chain_dash"}, default: "solid") – Line style of map grid lines.
map_grid_thickness (number, default: 1) – Thickness of map grid lines.
map_grid_colour (str, default: "black") – Colour of map grid lines.
map_grid_latitude_reference (number, default: 0) – Reference latitude from which all latitude grid lines are drawn.
map_grid_latitude_increment (number, default: 10) – Interval (in degrees) between latitude grid lines.
map_grid_longitude_reference (number, default: 0) – Reference longitude from which all longitude lines are drawn.
map_grid_longitude_increment (number, default: 20) – Interval (in degrees) between longitude grid lines.
map_grid_frame ({"on", "off"}, default: "off") – Add a frame around the map.
map_grid_frame_line_style ({"solid", "dash", "dot", "chain_dot", "chain_dash"}, default: "solid") – Line style of map frame.
map_grid_frame_thickness (number, default: 1) – Thickness of map frame.
map_grid_frame_colour (str, default: "black") – Colour of map frame.
map_label ({"on", "off"}, default: "on") – Plots labels for map grid lines.
map_label_font ({"arial", "courier", "helvetica", "times", "serif", "sansserif", "symbol"}, default: "sansserif") – Font of map grid labels.
map_label_font_style ({"normal", "bold", "italic", "bolditalic"}, default: "normal") – Font style of map grid labels.
map_label_colour (str, default: "black") – Colour of map grid labels.
map_label_height (number, default: 0.25) – Height of map grid labels.
map_label_blanking ({"on", "off"}, default: "on") – Blanking of the grid labels.
map_label_latitude_frequency (number, default: 1) – Every n-th latitude grid line is labelled.
map_label_longitude_frequency (number, default: 1) – Every n-th longitude grid line is labelled.
map_label_left ({"on", "off"}, default: "on") – Enable the labels on the left of the map.
map_label_right ({"on", "off"}, default: "on") – Enable the labels on the right of the map.
map_label_top ({"on", "off"}, default: "on") – Enable the labels on the top of the map.
map_label_bottom ({"on", "off"}, default: "on") – Enable the labels on the bottom of the map.
map_user_layer ({"on", "off"}, default: "off") – Display user shape file layer.
map_user_layer_name (str) – Path to the shape file to use.
map_user_layer_colour (str, default: "blue") – Colour of the user layer.
map_user_layer_style ({"solid", "dash", "dot", "chain_dot", "chain_dash"}, default: "solid") – Line style of the user layer.
map_user_layer_thickness (number, default: 1) – Line thickness of the user layer.
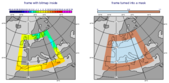
map_layer_mode ({"split", "foreground", "background"}, default: "split") –
Specifies how the background (land-sea shading) and foreground (grid, coastlines, rivers, borders and cities) map layers are rendered into the plot with respect to the data layers. The possible values are as follows:
”split”: the coastlines definition is split into background and foreground map layers. The background map layer is rendered first, followed by the data layers with the foreground map layers appearing atop
”foreground”: all the map layers are rendered on top of the data layers
”background”: all the map layers are rendered below the data layers
If
map_layer_modeis set to “split” and themcoast()appears after the data objects inplot(), the coastlines are put on top of the data. This behaviour is required in order to maintain backward compatibility.
- Return type
Request