Note
Click here to download the full example code
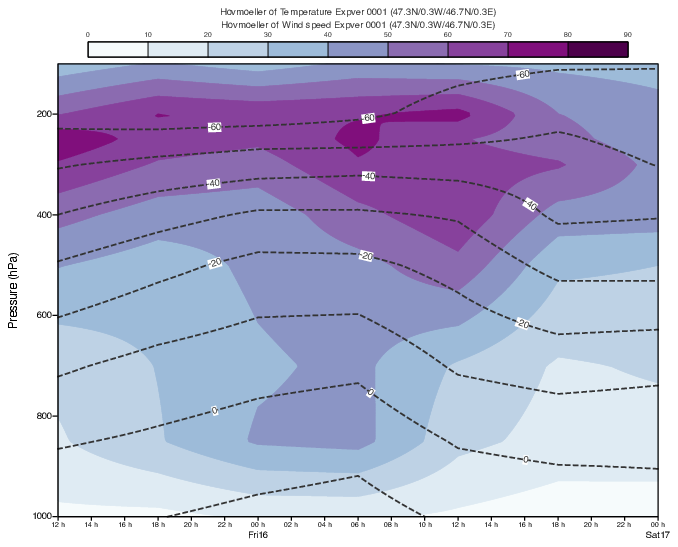
GRIB - Time-height Section Hovmoeller
# (C) Copyright 2017- ECMWF.
#
# This software is licensed under the terms of the Apache Licence Version 2.0
# which can be obtained at http://www.apache.org/licenses/LICENSE-2.0.
#
# In applying this licence, ECMWF does not waive the privileges and immunities
# granted to it by virtue of its status as an intergovernmental organisation
# nor does it submit to any jurisdiction.
#

import metview as mv

# read GRIB forecast data
filename = "joachim_pl.grib"
if mv.exist(filename):
    data = mv.read(filename)
else:
    data = mv.gallery.load_dataset(filename)

delta = 0.3
# The vertical hovmoeller modules take an area as an input.
# We define the location by shrinking down the area to a point,
# using a delta adjusted to the grid resolution (0.5x0.5 degrees)
loc = [47, 0]  # lat/lon
area = [loc[0] + delta, loc[1] - delta, loc[0] - delta, loc[1] + delta]  # N/W/S/E

# read temperature fields and convert from K to C
t = mv.read(data=data, param="t")
t = t - 273.16

# read u and v fields and computes wind speed
u = mv.read(data=data, param="u")
v = mv.read(data=data, param="v")
sp = mv.sqrt(u ** 2 + v ** 2)
sp = mv.grib_set_long(sp, ["paramId", 10])

# define isoline shading for speed
sp_cont = mv.mcont(
    legend="on",
    contour="off",
    contour_level_selection_type="interval",
    contour_max_level=90,
    contour_min_level=0,
    contour_interval=10,
    contour_label="off",
    contour_shade="on",
    contour_shade_colour_method="palette",
    contour_shade_method="area_fill",
    contour_shade_palette_name="m_purple_9",
)

# define contouring for t
t_cont = mv.mcont(
    contour_line_style="dash",
    contour_line_thickness=3,
    contour_line_colour="charcoal",
    contour_highlight="off",
    contour_level_selection_type="interval",
    contour_interval=10,
    contour_label_height=0.4,
)

# define time axis
time_axis = mv.maxis(
    axis_type="date",
    axis_tick_label_height=0.4,
    axis_date_type="hours",
    axis_days_label_height=0.4,
    axis_hours_label="on",
    axis_hours_label_quality="high",
    axis_hours_label_height=0.3,
)

# define vertical axis
vert_axis = mv.maxis(
    axis_tick_label_height=0.4, axis_title_text="Pressure (hPa)", axis_title_height=0.5
)

# define hovmoeller view
view = mv.mhovmoellerview(
    type="vertical_hovm",
    bottom_level=1000,
    top_level=100,
    area=area,
    time_axis=time_axis,
    vertical_axis=vert_axis,
    subpage_y_position=5,
)

# define legend
legend = mv.mlegend(legend_text_font_size=0.3, legend_text_colour="charcoal")

# define title
title = mv.mtext(text_font_size=0.4, text_colour="charcoal")

# define the output plot file
mv.setoutput(mv.pdf_output(output_name="time_height_xs"))

# generate plot
mv.plot(view, sp, sp_cont, t, t_cont, legend, title)