map_style_gallery
- map_style_gallery()
New in metview-python version 1.8.0
Generates a gallery of the built-in map styles in a Jupyter notebook.
Technically, each map style is defined by an
mcoast()object. The list of available map styles depends on the actual style configuration. By default, when no custom style configuration is loaded, the style list comprises:the style called “base”, which is the default map style used by
plot()andplot_maps()the style called “base_diff”, which is the default style used by
plot_diff_maps()other styles
The map styles can only be used in
make_geoview()to create map-based views, e.g.:view = mv.make_geoview(area="pacific", style="grey_light_blue")
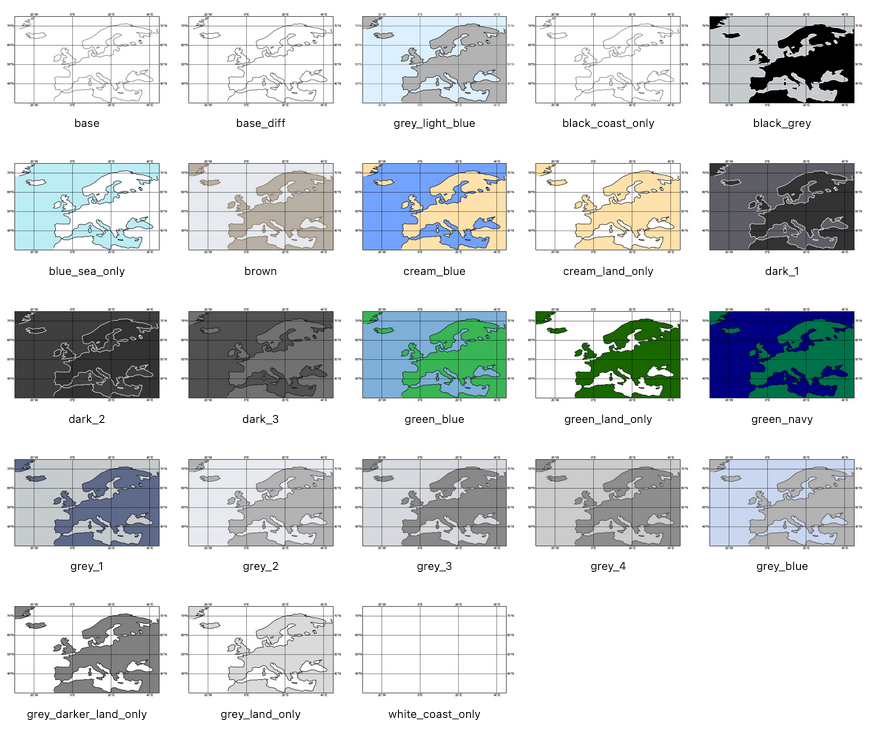
The default map style gallery looks like this: