plot_diff_maps
- plot_diff_maps(fs1, [vd1, ]fs2, [vd2, ]view=None, area=None, overlay=None, diff_style=[], pos_values=[], title_font_size=0.4, legend_font_size=0.35, frame=-1, animate="auto")
New in metview-python version 1.8.0
High level function to generate difference plots between two
Fieldsetobjects (fs1andfs2).- Parameters
fs1 (
Fieldset) – specifies the first inputFieldset. Has to contain the same number of fields on the same grid asfs2.fs2 (
Fieldset) – specifies the second inputFieldset. Has to contain the same number of fields on the same grid asfs1.view (
geoview()) – specifies the map view as ageoview(). Ifareais also specified the projection in the view is changed to cylindrical (but the map style is kept). Seemake_geoview()on how to build a view with predefined areas and map styles.area (str or list) – specifies the map area. It can be either a named built-in area or a list in the format of [S, W, N, E]. When
areais a list a cylindrical map projection is used.overlay (data-like, list or tuple) – specifies the data and the corresponding style that should be plotted as an overlay onto each map
diff_style (an
mcont()or list of these) – user defined contouring style for the difference plots. If it is not defined a predefined style is used.pos_values (a style or list of styles) – all the predefined difference contour styles use two
mcont()objects; the first defining the negative value range while the other the positive one. The value ranges are symmetrical i.e. mirrored to 0.pos_valuesallows to define a new value range for the default style; it sets the positive value range and the negative one is automatically generated from it.title_font_size (number) – specifies the font size in cm for the plot title
legend_font_size (number) – specifies the font size in cm for the plot legend
frame (number) – specifies which animation frames should be plotted, -1 means all the frames will be plotted
animate (str or bool) – controls the plotting of multiple animation frames
plot_diff_maps() is a convenience function allowing to plot the difference between the fs1 and fs2 Fieldset objects in a simple way using predefined settings.
Layout
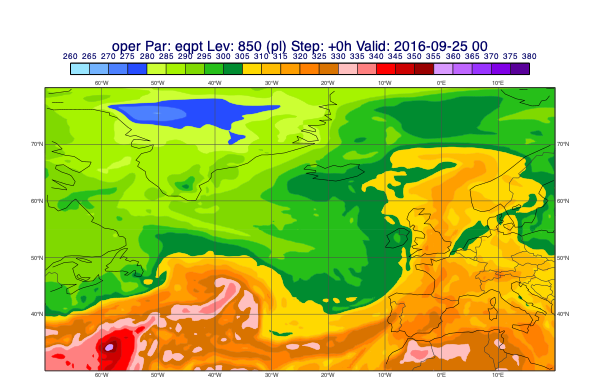
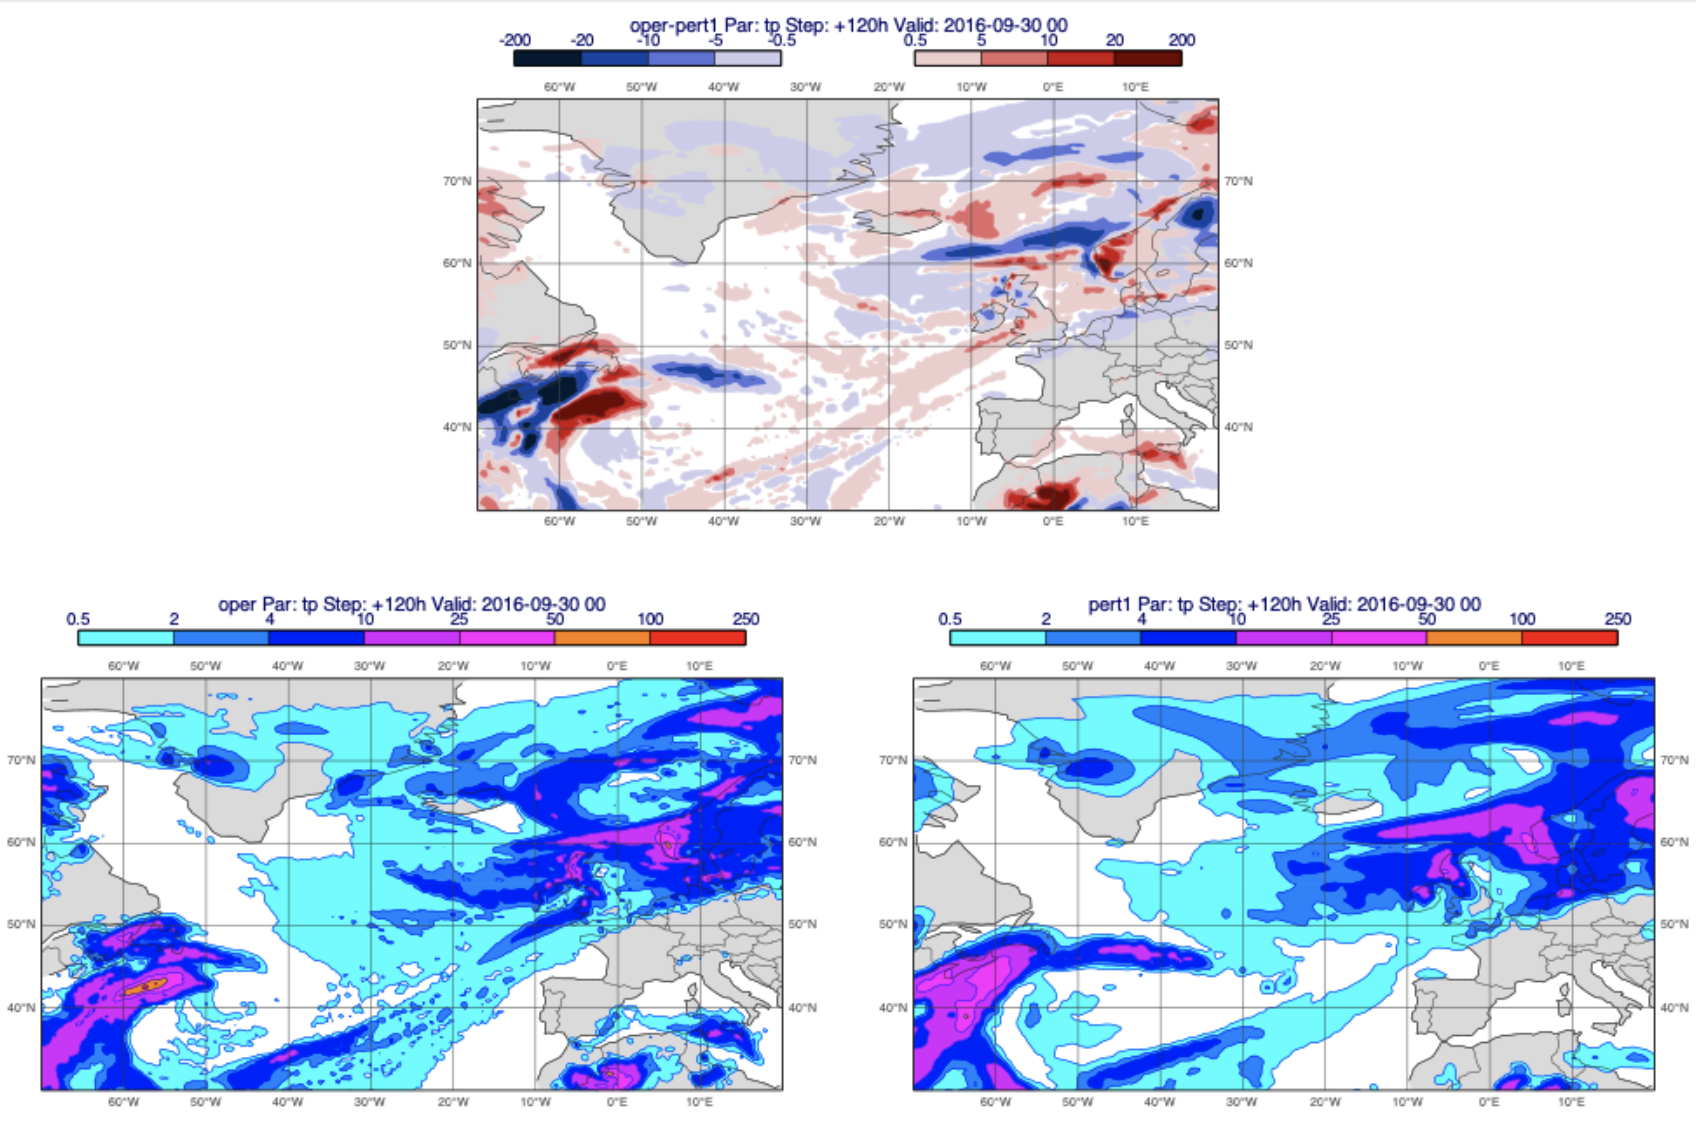
The layout is fixed: fs1 and fs2 are always plotted in the bottom row while their difference (fs1 - fs2) will appear in the top row, as the snapshot below illustrates it:
Styling the input data maps
The corresponding styles for f1 and f2 are defined by the positional arguments (*args). In the argument list both f1 and f2 can be followed by any number of visual definitions, which define the plotting style for the given data. If no style is specified for a data object the style will be automatically generated using the currently loaded style configuration.
Styling the difference map
The contouring style for the difference plot is defined by diff_style: it can be a single mcont() or a list of it. If no style is specified the it will be automatically generated using the currently loaded style configuration. In this case pos_values can be used to adjust the contour value range.
Limitations
While the data and map view styles can be fully customised, the title and legend are automatically built and no control is offered over them.