Note
Click here to download the full example code
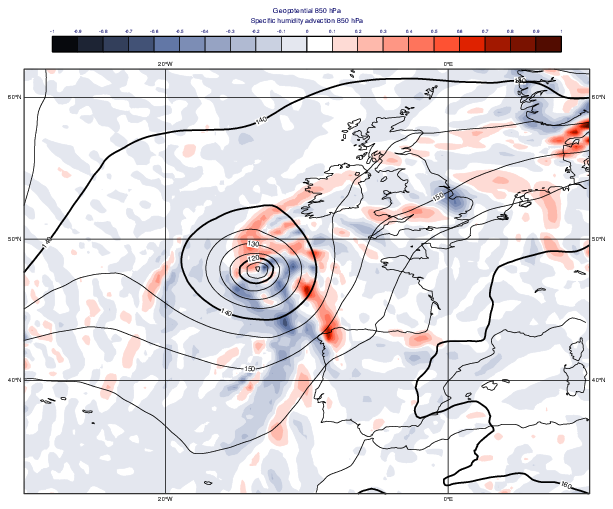
GRIB - Humidity advection
# (C) Copyright 2017- ECMWF.
#
# This software is licensed under the terms of the Apache Licence Version 2.0
# which can be obtained at http://www.apache.org/licenses/LICENSE-2.0.
#
# In applying this licence, ECMWF does not waive the privileges and immunities
# granted to it by virtue of its status as an intergovernmental organisation
# nor does it submit to any jurisdiction.
#

import metview as mv

# read grib - contains fields on 850 hPa
filename = "advection_850.grib"
if mv.exist(filename):
    f = mv.read(filename)
else:
    f = mv.gallery.load_dataset(filename)

# extract fields
q = mv.read(data=f, param="q")
u = mv.read(data=f, param="u")
v = mv.read(data=f, param="v")
z = mv.read(data=f, param="z")

# compute specific humidity gradient
grad = mv.gradient(q[0])

# compute humidity advection
adv = -(u[0] * grad[0] + v[0] * grad[1])

# scale results for better visualisation
adv = adv * 1e6

# define contour shading for advection
adv_cont = mv.mcont(
    legend="on",
    contour="off",
    contour_level_count=21,
    contour_label="off",
    contour_max_level=1,
    contour_min_level=-1,
    contour_shade="on",
    contour_shade_colour_method="palette",
    contour_shade_method="area_fill",
    contour_shade_palette_name="eccharts_black_red_21",
)

# define contouring for geopotential
z_cont = mv.mcont(
    contour_line_colour="black",
    contour_highlight_colour="black",
    contour_level_selection_type="interval",
    contour_interval=5,
)

# define map view
view = mv.geoview(map_area_definition="corners", area=[32, -30, 62, 10])

# define title
title = mv.mtext(
    text_lines=["Geopotential 850 hPa", "Specific humidity advection 850 hPa"]
)

# define the output plot file
mv.setoutput(mv.pdf_output(output_name="advection"))

# generate plot
mv.plot(view, adv, adv_cont, z[0], z_cont, title)