geoview

Defines a geographical view. For further details on the role and usage of views in the visualisation process, please see Anaylis Views.
Note
This function performs the same task as the Geographical View icon in Metview’s user interface. It accepts its parameters as keyword arguments, described below.
- geoview(**kwargs)
Defines a geographical view.
- Parameters
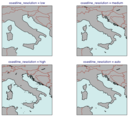
coastlines (
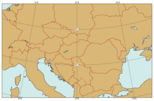
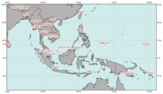
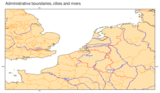
mcoast()) – Defines the map plotting style as amcoast()object.area_mode ({"name", "user"}, default: "user") – Selects the area definition mode. When it is “name” a named area can be specified. Otherwise, when it is “user”, the projection parameters can be manually set.
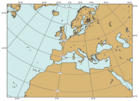
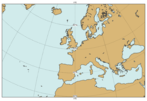
area_name (str, default: "europe") – Specifies the area (and projection) by name. Enabled when
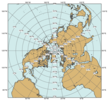
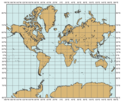
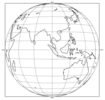
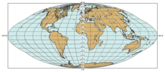
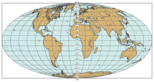
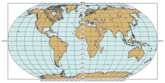
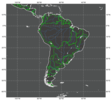
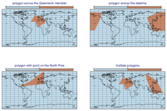
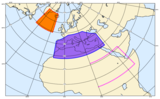
area_modeis “name”. Seemap_area_gallery()for the available named areas.map_projection (str, default: "cylindrical") – Defines the map projection when
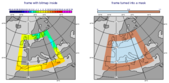
area_modeis “user”.map_area_definition ({"corners", "centre", "full"}, default: "full") – Specifies how the map projection is defined when
area_modeis “user”.area (list[number], default: [-90, -180, 90, 180]) – The default corner points of the projection when
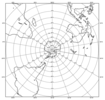
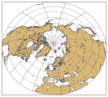
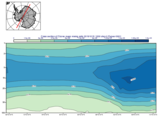
map_area_definitionis “corner”. The format is [S,W,N,E].map_hemisphere ({"north", "south"}, default: "north") – Defines the map hemisphere when
map_projectionis “polar_stereographic”.map_vertical_longitude (number, default: 0) –
map_centre_latitude (number, default: 90.0) – Defines the map centre latitude. Enabled when
map_area_definitionis “centre” andmap_projectionis “polar_stereographic”.map_centre_longitude (number, default: 0.0) – Defines the map centre longitude. Enabled when
map_area_definitionis “centre” andmap_projectionis “polar_stereographic”.map_scale (number, default: 50e6) – Defines the map scale. Enabled when
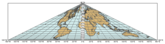
map_area_definitionis “centre” andmap_projectionis “polar_stereographic”.map_projection_height (str, default: "42164000") –
map_projection_tilt (str, default: "0.0") –
map_projection_azimuth (str, default: "20.0") –
map_projection_view_latitude (str, default: "20.0") –
map_projection_view_longitude (str, default: "-60.0") –
map_overlay_control ({"always", "by_date", "by_level", "never"}, default: "always") –
subpage_clipping ({"on", "off"}, default: "off") – Clips plot to subpage borders.
subpage_x_position (number, default: 7.5) – Specifies the X offset of the plot from the left side of the plot frame (any subdivision of the display area). This is expressed as a percentage of the X-dimension of the plot frame.
subpage_y_position (number, default: 5) – Specifies the Y offset of the plot from the bottom side of the plot frame (any subdivision of the display area). This is expressed as a percentage of the Y-dimension of the plot frame.
subpage_x_length (number, default: 85) – Specifies the X length of the plot. This is expressed as a percentage of the X-dimension of the plot frame. Hence the sum of this X length plus the X offset cannot exceed 100 (it is advised that it does not exceed 95 since you need some margin on the right for things like axis or map grid labels).
subpage_y_length (number, default: 85) – Same as
subpage_x_lengthbut for the Y length of the plot.subpage_metadata_info ({"on", "off"}, default: "off") –
subpage_metadata_javascript_path (str, default: "map.js") –
page_frame ({"on", "off"}, default: "off") – Toggles the plotting of a border line around the plot frame.
page_frame_colour (str, default: "charcoal") – Colour of the page frame. Available when
page_frameis “on”.page_frame_line_style ({"solid", "dot", "dash", "chain_dot", "chain_dash"}, default: "solid") – Line style of the page frame. Available when
page_frameis “on”.page_frame_thickness (number, default: 2) – Line thickness of the page frame. Available when
page_frameis “on”.page_id_line ({"on", "off"}, default: "off") – Toggles the plotting of plot identification line.
page_id_line_user_text (str) – Specifies user text to be added to the plot identification line. Only available when
page_id_lineis “on”.subpage_frame ({"on", "off"}, default: "off") – Toggles the plotting of a border line around the plot itself. In most cases you will want this to be left “on”. When “off” the sides of the plot not equipped with axis will not be plotted.
subpage_frame_colour (str, default: "black") – Colour of the subpage frame. Available when
subpage_frameis “on”.subpage_frame_line_style ({"solid", "dot", "dash", "chain_dot", "chain_dash"}, default: "solid") – Line style of the subpage frame. Available when
subpage_frameis “on”.subpage_frame_thickness (int, default: 2) – Line thickness of the subpage frame. Available when
subpage_frameis “on”.subpage_background_colour (str, default: "white") – Specifies the colour of the background of the plot (i.e. not affected by visual definitions like contour shadings or lines).
- Return type
Request