Note
Click here to download the full example code
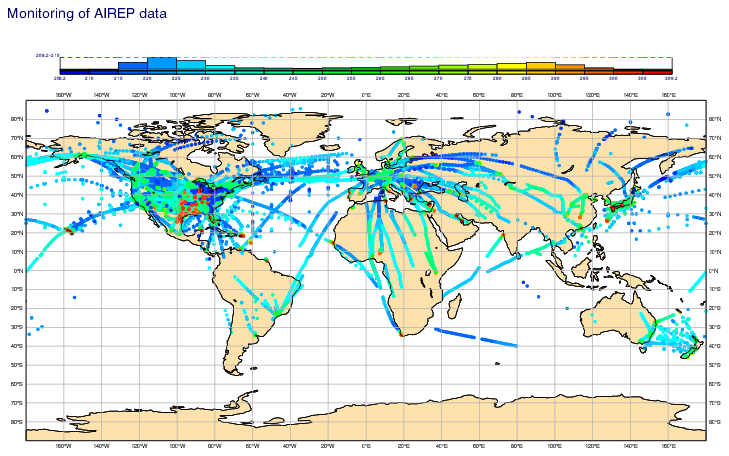
Geopoints - Aircraft observations
# (C) Copyright 2017- ECMWF.
#
# This software is licensed under the terms of the Apache Licence Version 2.0
# which can be obtained at http://www.apache.org/licenses/LICENSE-2.0.
#
# In applying this licence, ECMWF does not waive the privileges and immunities
# granted to it by virtue of its status as an intergovernmental organisation
# nor does it submit to any jurisdiction.
#

import metview as mv

# read the input geopoints file
filename = "airep.geo"
if mv.exist(filename):
    my_data = mv.read(filename)
else:
    my_data = mv.gallery.load_dataset(filename)

# set up the data symbol and colour
my_symbol = mv.msymb(
    symbol_type="marker",
    symbol_marker_index=15,
    symbol_table_mode="advanced",
    symbol_advanced_table_selection_type="interval",
    symbol_advanced_table_colour_direction="clockwise",
    symbol_advanced_table_max_level_colour="red",
    symbol_advanced_table_min_level_colour="blue",
    symbol_advanced_table_interval=5.00,
    legend="on",
)

# set up the contour so that observed values are mapped into a colour list
my_contour = mv.mcont(
    contour_grid_value_plot="on",
    contour_grid_value_plot_type="both",
    contour_grid_value_height=0.30,
    contour_grid_value_marker_height=0.20,
    contour_level_selection_type="level_list",
    contour_level_list=[-20, -10, -5, -2.5, -1, -0.5, 0, 0.5, 1, 2.5, 5, 10, 20],
    contour_line_colour="grey",
    contour_line_thickness=2,
    contour_highlight="off",
    contour_label="off",
    contour_grid_value_lon_frequency=10,
    contour_grid_value_lat_frequency=10,
    legend="off",
)

# legend type is histogram
my_legend = mv.mlegend(legend_text_colour="navy", legend_display_type="histogram")

# set up the coastlines
my_coast = mv.mcoast(
    map_coastline_land_shade="on",
    map_coastline_land_shade_colour="cream",
    map_grid="on",
    map_grid_colour="grey",
)

# set up the title
my_title = mv.mtext(
    text_mode="positional",
    text_font_size=0.60,
    text_justification="left",
    text_border="off",
    text_lines=["Monitoring of AIREP data"],
    text_box_x_length=20.00,
    text_box_y_length=2.50,
    text_box_x_position=1.50,
    text_box_y_position=16.50,
    text_colour="navy",
)

# define the output plot file
mv.setoutput(mv.pdf_output(output_name="air_report"))

# plot the data onto the map
mv.plot(my_coast, my_data, my_symbol, my_title, my_legend)