Note
Click here to download the full example code
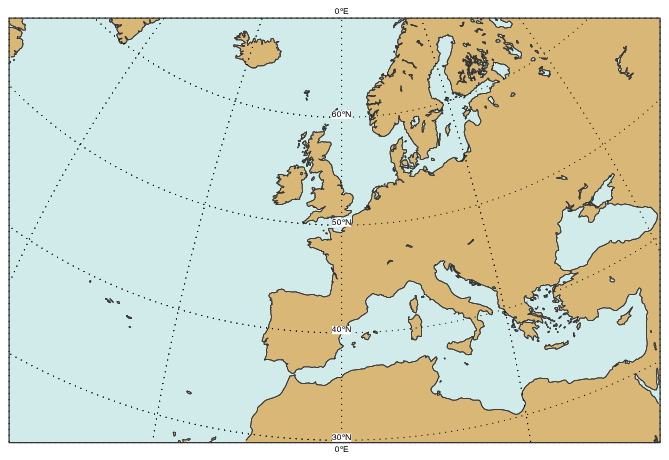
Bonne Projection on Subarea
# (C) Copyright 2017- ECMWF.
#
# This software is licensed under the terms of the Apache Licence Version 2.0
# which can be obtained at http://www.apache.org/licenses/LICENSE-2.0.
#
# In applying this licence, ECMWF does not waive the privileges and immunities
# granted to it by virtue of its status as an intergovernmental organisation
# nor does it submit to any jurisdiction.
#

import metview as mv

# define coastlines
coast = mv.mcoast(
    map_coastline_colour="charcoal",
    map_coastline_resolution="medium",
    map_coastline_land_shade="on",
    map_coastline_land_shade_colour="beige",
    map_coastline_sea_shade="on",
    map_coastline_sea_shade_colour="RGB(0.8178,0.9234,0.9234)",
    map_grid_line_style="dot",
    map_label_height=0.35,
)


# define view
view = mv.geoview(
    map_projection="bonne",
    map_area_definition="corners",
    area=[22.62, -34.6, 55.12, 59.04],
    coastlines=coast,
)

# define the output plot file
mv.setoutput(mv.pdf_output(output_name="bonne_subarea"))

# plot the data onto the map
mv.plot(view)