Note
Click here to download the full example code
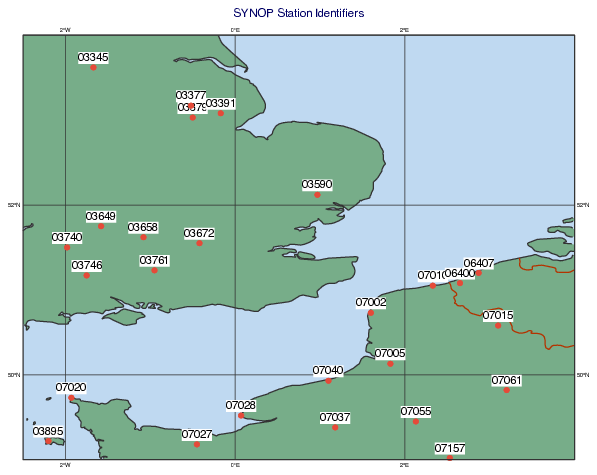
BUFR - Plotting SYNOP Station Ids
# (C) Copyright 2017- ECMWF.
#
# This software is licensed under the terms of the Apache Licence Version 2.0
# which can be obtained at http://www.apache.org/licenses/LICENSE-2.0.
#
# In applying this licence, ECMWF does not waive the privileges and immunities
# granted to it by virtue of its status as an intergovernmental organisation
# nor does it submit to any jurisdiction.
#

import metview as mv

# read synop bufr
filename = "synop.bufr"
if mv.exist(filename):
    bf = mv.read(filename)
else:
    bf = mv.gallery.load_dataset(filename)

# extract station ids. The problem with SYNOP station id is that it is the
# combination of two bufr parameters= blockNumber and stationNumber.
# We use NCOLS geopoints as an output because the combined station id is automatically
# extracted as a column. So the actual parameter set for the filter is not relevant
# at all (it just has to exist for the messages).
gpt = mv.obsfilter(
    output="ncols",
    parameter="year",
    data=bf,
    location_filter="area",
    area=[45, -8, 55, 5],
)

# read station ids into a list
id_lst = mv.stnids(gpt)


# since station ids can be non-numeric, we will need to use the 'text' mode
# of msymb(). This requires associating each point with its text label, so we will
# generate values of 1,2,3,4,...,N for the geopoints and create an msymb() that
# maps each value to a station id.

vals = list(range(len(gpt)+1))
gpt = gpt.set_values(vals)
sym_txt = mv.msymb(
    legend="off",
    symbol_type                          = "text",
    symbol_table_mode                    = "advanced",
    symbol_advanced_table_selection_type = "list",
    symbol_advanced_table_level_list     = vals,
    symbol_advanced_table_text_list      = id_lst,
    symbol_advanced_table_text_font_size = 0.5,
    symbol_advanced_table_text_display_type = "top",
    symbol_text_blanking                 = "on", #  requires Magics >=4.8.1
    )

#  define station location plotting
sym_loc = mv.msymb(
    legend="off",
    symbol_type="marker",
    symbol_colour="coral",
    symbol_height=0.4,
    symbol_marker_index=15,
)

# define coastlines
coast = mv.mcoast(
    map_coastline_colour="charcoal",
    map_coastline_thickness=2,
    map_coastline_land_shade="on",
    map_coastline_land_shade_colour="RGB(0.4669,0.6782,0.5373)",
    map_coastline_sea_shade="on",
    map_coastline_sea_shade_colour="RGB(0.7475,0.8504,0.9466)",
    map_boundaries="on",
    map_boundaries_colour="rust",
    map_boundaries_thickness=2,
    map_grid_colour="charcoal",
    map_grid_latitude_increment=2,
    map_grid_longitude_increment=2,
    map_layer_mode="background",
)

# define map view
view = mv.geoview(
    map_area_definition="corners", area=[49, -2.5, 54, 4], coastlines=coast
)

# define title
title = mv.mtext(text_line_1="SYNOP Station Identifiers", text_font_size=0.5)

# define the output plot file
mv.setoutput(mv.pdf_output(output_name="bufr_synop_station_id"))

# generate plot
mv.plot(view, gpt, sym_txt, sym_loc, title)