Note
Click here to download the full example code
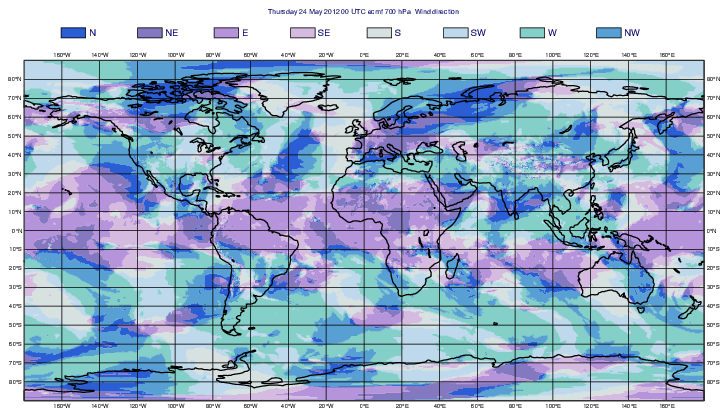
GRIB - Categorical Wind Direction
# (C) Copyright 2017- ECMWF.
#
# This software is licensed under the terms of the Apache Licence Version 2.0
# which can be obtained at http://www.apache.org/licenses/LICENSE-2.0.
#
# In applying this licence, ECMWF does not waive the privileges and immunities
# granted to it by virtue of its status as an intergovernmental organisation
# nor does it submit to any jurisdiction.

import metview as mv

# get input grib file
filename = "wind.grib"
if mv.exist(filename):
    f = mv.read(filename)
else:
    f = mv.gallery.load_dataset(filename)

# interpolate data onto a coarser grid
f = mv.read(data=f, grid=[0.5, 0.5])

# extract u and v components and compute direction
u = f.select(shortName="u")
v = f.select(shortName="v")
d = mv.direction(u, v)
d = mv.grib_set_long(d, ["paramId", 3031])

# we want to plot this data using categories according to the directions
# such as North, North-East etc. The problem is North because it should
# take values from the [0-22.5] and [337.5-360] intervals. The contouring
# is not able to merge these into one (it does not have the concept of
# periodic data) so we modify the data and move the [337.5, 360] range
# into [-22.5, 0] and form North as N=[-22.5, 22.5].

# define mask
msk = d > 337.5

# convert values in the [337.5, 360] range into [-22.5, 0] range
d = (d - 360) * msk + d * (1 - msk)

# define contour shading. We use grid shading here. Polygon shading
# also works but there are some interpolation artifacts between neighbouring
# NW=[292.5, 337.5] and N=[-22.5, 22.5] values.
cont_dir = mv.mcont(
    legend="on",
    contour="off",
    contour_level_selection_type="level_list",
    contour_level_list=[-22.5, 22.5, 67.5, 112.5, 157.5, 202.5, 247.5, 292.5, 337.5],
    contour_label="off",
    contour_shade="on",
    contour_shade_technique="grid_shading",
    contour_shade_colour_method="list",
    contour_shade_colour_list=[
        "RGB(0.168,0.3684,0.8359)",
        "RGB(0.5176,0.4755,0.7558)",
        "RGB(0.712,0.5785,0.8646)",
        "RGB(0.8342,0.7339,0.8739)",
        "RGB(0.8434,0.8821,0.877)",
        "RGB(0.7455,0.8503,0.9251)",
        "RGB(0.5203,0.8131,0.7887)",
        "RGB(0.3444,0.6289,0.8321)",
    ],
)

# define legend
legend = mv.mlegend(
    legend_display_type="disjoint",
    legend_text_font_size=0.4,
    legend_text_composition="user_text_only",
    legend_user_lines=["N", "NE", "E", "SE", "S", "SW", "W", "NW"],
)

# define coastlines
coast = mv.mcoast(map_coastline_thickness=2)

# define the output plot file
mv.setoutput(mv.pdf_output(output_name="categorical_wind_direction"))

# generate plot
mv.plot(coast, d, cont_dir, legend)