Note
Click here to download the full example code
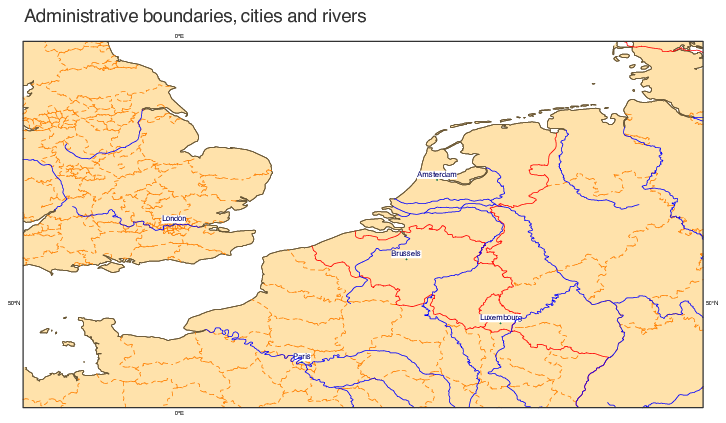
Boundaries, Cities and Rivers
# (C) Copyright 2017- ECMWF.
#
# This software is licensed under the terms of the Apache Licence Version 2.0
# which can be obtained at http://www.apache.org/licenses/LICENSE-2.0.
#
# In applying this licence, ECMWF does not waive the privileges and immunities
# granted to it by virtue of its status as an intergovernmental organisation
# nor does it submit to any jurisdiction.
#

import metview as mv

# set up the geographical view
my_view = mv.geoview(
    map_area_definition="CORNERS",
    map_projection="CYLINDRICAL",
    area=[48.00, -3.00, 55.00, 10.00],
)

# set up the coastlines so that cities, rivers, borders and admnistrative boundaries are shown
my_coast = mv.mcoast(
    map_administrative_boundaries_colour="ORANGE",
    map_boundaries="ON",
    map_coastline_resolution="HIGH",
    map_coastline_land_shade_colour="CREAM",
    map_cities="ON",
    map_grid="OFF",
    map_boundaries_colour="RED",
    map_grid_colour="TAN",
    map_rivers="ON",
    map_administrative_boundaries_countries_list=["FRA", "DEU", "GBR"],
    map_coastline_land_shade="ON",
    map_coastline_colour="TAN",
    map_administrative_boundaries="ON",
)

my_text = mv.mtext(
    text_font_size=0.80,
    text_lines=["Administrative boundaries, cities and rivers"],
    text_justification="LEFT",
    text_colour="CHARCOAL",
)


# define the output plot file
mv.setoutput(mv.pdf_output(output_name="coastlines2"))

# plot the map with the given style
mv.plot(my_view, my_coast, my_text)