Note
Click here to download the full example code
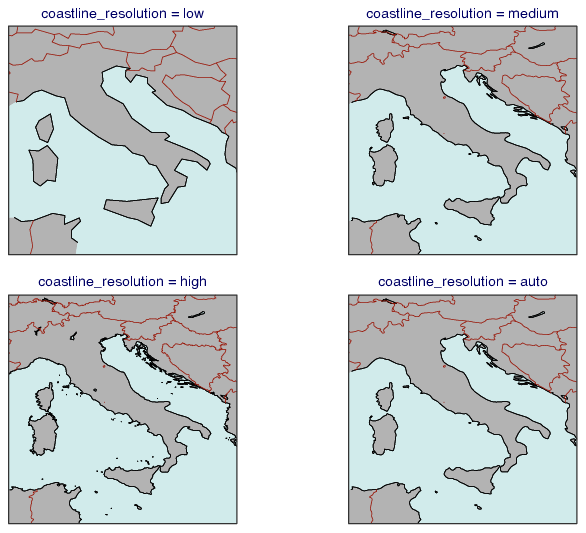
Coastlines Resolutions
# (C) Copyright 2017- ECMWF.
#
# This software is licensed under the terms of the Apache Licence Version 2.0
# which can be obtained at http://www.apache.org/licenses/LICENSE-2.0.
#
# In applying this licence, ECMWF does not waive the privileges and immunities
# granted to it by virtue of its status as an intergovernmental organisation
# nor does it submit to any jurisdiction.
#

import metview as mv

coast = []
title = []

# define coastlines and titles
for val in ["low", "medium", "high", "auto"]:
    coast.append(
        mv.mcoast(
            map_coastline_resolution=val,
            map_coastline_land_shade="on",
            map_coastline_land_shade_colour="grey",
            map_coastline_sea_shade="on",
            map_coastline_sea_shade_colour="RGB(0.8178,0.9234,0.9234)",
            map_boundaries="on",
            map_boundaries_colour="brick",
            map_grid="off",
            map_label="off",
        )
    )

    title.append(
        mv.mtext(text_lines=[f"coastline_resolution = {val}"], text_font_size=0.6)
    )

# define view
view = mv.geoview(map_area_definition="corners", area=[48, 7, 35, 20])

# create a 2x2 plot layout with the defined geoview
dw = mv.plot_superpage(pages=mv.mvl_regular_layout(view, 2, 2, 1, 1, [5, 100, 15, 100]))

# define output
mv.setoutput(mv.pdf_output(output_name="coastlines_resolution"))

# generate plot
mv.plot(
    dw[0],
    coast[0],
    title[0],
    dw[1],
    coast[1],
    title[1],
    dw[2],
    coast[2],
    title[2],
    dw[3],
    coast[3],
    title[3],
)