Note
Click here to download the full example code
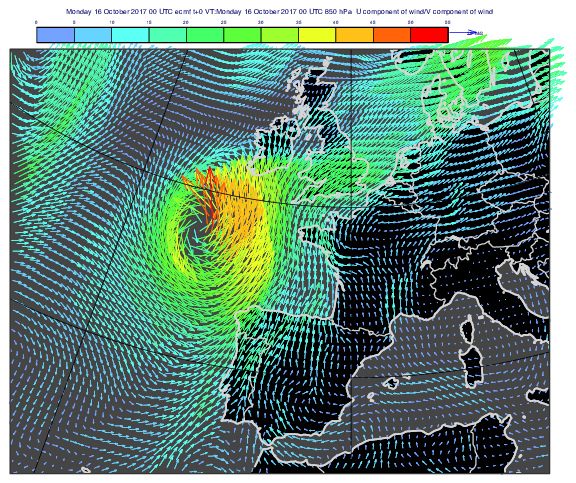
GRIB - Coloured Wind Vectors
# (C) Copyright 2017- ECMWF.
#
# This software is licensed under the terms of the Apache Licence Version 2.0
# which can be obtained at http://www.apache.org/licenses/LICENSE-2.0.
#
# In applying this licence, ECMWF does not waive the privileges and immunities
# granted to it by virtue of its status as an intergovernmental organisation
# nor does it submit to any jurisdiction.
#

import metview as mv

# get data
use_mars = False
if use_mars:
    # get data from MARS
    f = mv.retrieve(
        levelist=850,
        param=["u", "v"],
        date=20171016,
        time=0,
        area=[30, -40, 60, 30],
        grid=[0.5, 0.5],
    )
else:
    # read from grib file
    filename = "ophelia_wind_850.grib"
    if mv.exist(filename):
        f = mv.read(filename)
    else:
        f = mv.gallery.load_dataset(filename)

# define coastlines
coast = mv.mcoast(
    map_coastline_colour="RGB(0.8353,0.8353,0.8353)",
    map_coastline_thickness=3,
    map_coastline_land_shade="on",
    map_coastline_land_shade_colour="black",
    map_coastline_sea_shade="on",
    map_coastline_sea_shade_colour="RGB(0.27,0.27,0.27)",
    map_boundaries="on",
    map_boundaries_colour="RGB(0.8353,0.8353,0.8353)",
    map_boundaries_thickness=2,
    map_label="off",
)

# define view
view = mv.geoview(
    map_projection="polar_stereographic",
    map_area_definition="corners",
    area=[31.28, -21.36, 57.2, 23.93],
    coastlines=coast,
)

# define wind plotting
colour_wind = mv.mwind(
    wind_thinning_factor=0,
    legend="on",
    wind_advanced_method="on",
    wind_advanced_colour_selection_type="interval",
    wind_advanced_colour_max_value=55,
    wind_advanced_colour_min_value=0,
    wind_advanced_colour_level_interval=5,
    wind_advanced_colour_max_level_colour="red",
    wind_advanced_colour_min_level_colour="sky",
    wind_advanced_colour_direction="clockwise",
    wind_arrow_legend_text=" M/S",
)

# define the output plot file
mv.setoutput(mv.pdf_output(output_name="coloured_wind"))

# generate plot
mv.plot(view, f, colour_wind)