Note
Click here to download the full example code
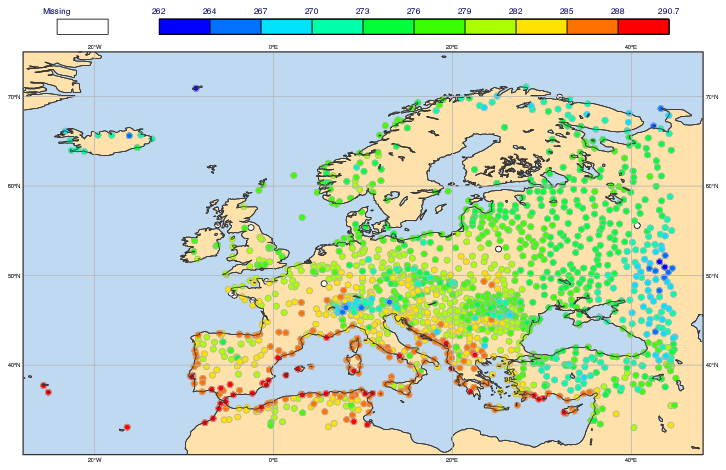
Geopoints - Missing Values in Geopoints
# (C) Copyright 2017- ECMWF.
#
# This software is licensed under the terms of the Apache Licence Version 2.0
# which can be obtained at http://www.apache.org/licenses/LICENSE-2.0.
#
# In applying this licence, ECMWF does not waive the privileges and immunities
# granted to it by virtue of its status as an intergovernmental organisation
# nor does it submit to any jurisdiction.
#

import metview as mv
import numpy as np

# Load a geopoints file containing two-metre temperature observations,
# some of which are missing values. We will plot the values in colours
# according to their values, but will also plot the missing values
# in white so that we can see their locations.

filename = "t2m.gpt"
if mv.exist(filename):
    t2m = mv.read(filename)
else:
    t2m = mv.gallery.load_dataset(filename)

# define the plotting style for the valid values
values_symb = mv.msymb(
    legend="on",
    symbol_type="marker",
    symbol_table_mode="advanced",
    symbol_advanced_table_max_level_colour="red",
    symbol_advanced_table_min_level_colour="blue",
    symbol_advanced_table_colour_direction="clockwise",
    symbol_advanced_table_height_list=0.45,
    symbol_outline="on",
    symbol_outline_colour="grey"
    )

# define the plotting style for the missing values
miss_symb = mv.msymb(
    symbol_type="marker",
    symbol_outline="on",
    symbol_outline_colour="black",
    symbol_colour="white",
    symbol_height=0.45,
    symbol_marker_index=15,
    legend="on",
    legend_user_text="Missing"
    )

# set up the coastlines
my_coast = mv.mcoast(
    map_coastline_colour="charcoal",
    map_coastline_land_shade="on",
    map_coastline_land_shade_colour="cream",
    map_coastline_sea_shade="on",
    map_coastline_sea_shade_colour="RGB(0.7475,0.8504,0.9466)",
    map_grid="on",
    map_grid_colour="grey",
)

# set the view area
view = mv.geoview(
    map_area_definition="corners",
    area=[30, -28, 75, 48],
    coastlines=my_coast,
)

# adjust the legend
legend = mv.mlegend(legend_text_font_size=0.35)

# the points with missing values won't be plotted, so
# get the points with missing values, turn them into
# zeros and plot separately
missing = mv.filter(t2m, np.isnan(t2m.values()))
missing = missing.set_values(np.nan_to_num(missing.values(), 0))

# define the output plot file
mv.setoutput(mv.pdf_output(output_name="gpts_with_missing_vals"))

# into the view, plot first the missing points, then the rest
mv.plot(view, missing, miss_symb, t2m, values_symb, legend)