Note
Click here to download the full example code
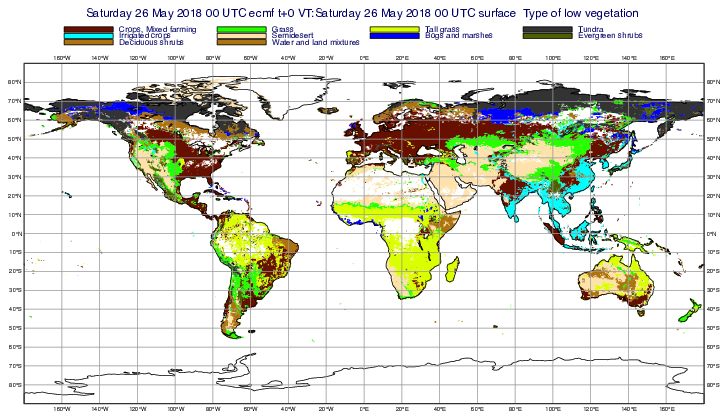
GRIB - Low Vegetation Type with Column Legend ERA5
# (C) Copyright 2017- ECMWF.
#
# This software is licensed under the terms of the Apache Licence Version 2.0
# which can be obtained at http://www.apache.org/licenses/LICENSE-2.0.
#
# In applying this licence, ECMWF does not waive the privileges and immunities
# granted to it by virtue of its status as an intergovernmental organisation
# nor does it submit to any jurisdiction.
#

import metview as mv

# getting data
use_cds = False

filename = "vegetation_type_era5.grib"

# getting forecast data from CDS
if use_cds:
    import cdsapi

    c.retrieve(
        "reanalysis-era5-single-levels",
        {
            "product_type": "reanalysis",
            "format": "grib",
            "variable": [
                "type_of_high_vegetation",
                "type_of_low_vegetation",
            ],
            "area": [
                90,
                -180,
                -90,
                180,
            ],
            "year": "2018",
            "month": "05",
            "day": "26",
            "time": "00:00",
        },
        filename,
    )

# read data from file
else:
    if mv.exist(filename):
        g = mv.read(filename)
    else:
        g = mv.gallery.load_dataset(filename)

# get low-vegetation field, it contains categorical values
tvl = g.select(shortName="tvl")

# define contouring
cont_shading = mv.mcont(
    legend="on",
    contour="off",
    contour_level_selection_type="level_list",
    contour_level_list=[1, 2, 7, 9, 10, 11, 13, 16, 17, 20, 21],
    contour_label="off",
    contour_shade="on",
    contour_shade_technique="grid_shading",
    contour_shade_colour_method="list",
    contour_shade_colour_list=[
        "brown",
        "yellowish_green",
        "greenish_yellow",
        "charcoal",
        "blue_green",
        "cream",
        "blue",
        "olive",
        "ochre",
    ],
)

# define legend containing 4 columns
legend = mv.mlegend(
    legend_display_type="disjoint",
    legend_text_font_size=0.35,
    legend_text_composition="user_text_only",
    legend_user_lines=[
        "Crops, Mixed farming",
        "Grass",
        "Tall grass",
        "Tundra",
        "Irrigated crops",
        "Semidesert",
        "Bogs and marshes",
        "Evergreen shrubs",
        "Deciduous shrubs",
        "Water and land mixtures",
    ],
    legend_column_count=4,
)


# define coastlines
coast = mv.mcoast(map_grid_colour="RGB(0.5922,0.5922,0.5922)")

# define title
title = mv.mtext(text_font_size=0.5)

# define output
mv.setoutput(mv.pdf_output(output_name="low_vegetation_type"))


# generate plot
mv.plot(coast, tvl, cont_shading, legend, title)