Note
Click here to download the full example code
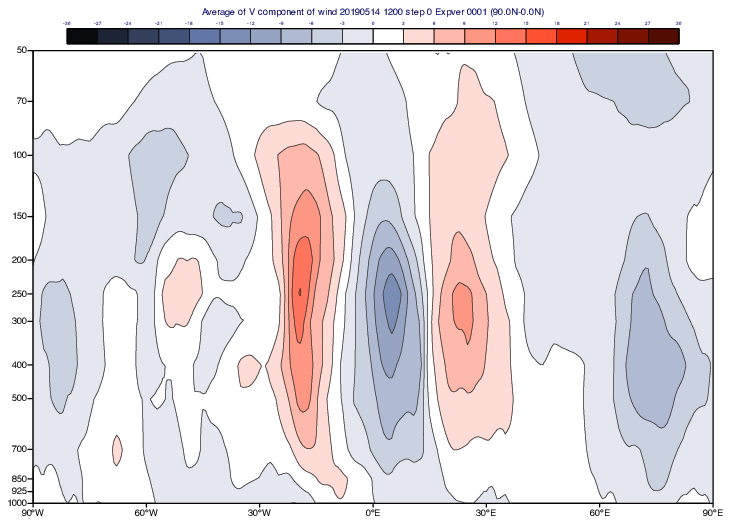
GRIB - Meridional Average
# (C) Copyright 2017- ECMWF.
#
# This software is licensed under the terms of the Apache Licence Version 2.0
# which can be obtained at http://www.apache.org/licenses/LICENSE-2.0.
#
# In applying this licence, ECMWF does not waive the privileges and immunities
# granted to it by virtue of its status as an intergovernmental organisation
# nor does it submit to any jurisdiction.
#

import metview as mv

# read pressure level data
filename = "avg_tuv.grib"
if mv.exist(filename):
    g = mv.read(filename)
else:
    g = mv.gallery.load_dataset(filename)

# filter v (meridional component)
v = mv.read(data=g, param="v")

# define horizontal axis
horiz_axis = mv.maxis(axis_tick_label_height=0.4)

# define vertical axis
vertical_axis = mv.maxis(
    axis_orientation="vertical",
    axis_type="position_list",
    axis_tick_position_list=[
        1000,
        925,
        850,
        700,
        500,
        400,
        300,
        250,
        200,
        150,
        100,
        70,
        50,
    ],
    axis_tick_label_height=0.4,
)

# define averaging area - one half of the Northern Hemisphere
area = [90, -90, 0, 90]  # N,W,S,E

# define average view for meridional mean
view = mv.maverageview(
    top_level=50,
    bottom_level=1000,
    vertical_scaling="log",
    area=area,
    direction="ns",
    horizontal_axis=horiz_axis,
    vertical_axis=vertical_axis,
)

# define isoline shading for v
cont_v = mv.mcont(
    legend="on",
    contour_line_colour="charcoal",
    contour_highlight="off",
    contour_max_level=30,
    contour_min_level=-30,
    contour_level_count=22,
    contour_label="off",
    contour_shade="on",
    contour_shade_colour_method="palette",
    contour_shade_method="area_fill",
    contour_shade_palette_name="eccharts_black_red_21",
)

title = mv.mtext(text_font_size=0.4)

# define the output plot file
mv.setoutput(mv.pdf_output(output_name="meridional_average"))

# generate plot
mv.plot(view, v, cont_v, title)