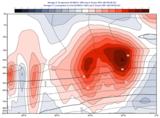
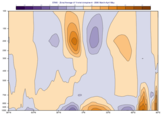
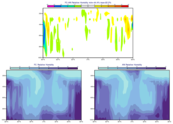
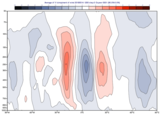
maverageview
Defines the view for average (zonal or meridional) cross-section plots from a suitable GRIB data source. It can also take the output of mxs_average() as an input. In this case, a consistency check is performed between the parameters that are common to both functions.
In addition to the parameters required for the average cross section computation, maverageview() specifies the axis details as well as the plot positioning in the plot frame of the display window / paper sheet.
For further details on the role and usage of views in the visualisation process, please see Anaylis Views.
Note
This function performs the same task as the Average View icon in Metview’s user interface. It accepts its parameters as keyword arguments, described below.
- maverageview(**kwargs)
Defines the view for average (zonal or meridional) cross-section plots.
- Parameters
bottom_level (number, default: 1015.0) – Specifies the lower limit of the average cross section, as a pressure value (hPa) or ECMWF model level number (hybrid levels).
top_level (number, default: 0.01) – Specifies the upper limit of the average cross section, as a pressure value (hPa) or ECMWF model level number (hybrid levels).
vertical_scaling ({"linear", "log"}, default: "linear") – Specifies the type of the vertical axis.
area (list, default: [90, -180, -90, 180]) – Specifies the coordinates of the area (as [north, west, south, east]) over which the average cross section is calculated.
direction ({"ns", "ew"}, default: "ns") – Specifies the direction along which the averaging is performed. Options are “ns” (north-south) and “ew” (east-west). For “ns” the averaging is weighted by the cosine of the latitudes.
horizontal_axis (
maxis()) – Specifies the plotting attributes of the horizontal axis.vertical_axis (
maxis()) – Specifies the plotting attributes of the vertical axis.subpage_clipping ({"on", "off"}, default: "off") – Clips plot to subpage borders.
subpage_x_position (number, default: 0) – Specifies the X offset of the plot from the left side of the plot frame (any subdivision of the display area). This is expressed as a percentage of the X-dimension of the plot frame.
subpage_y_position (number, default: 0) – Specifies the Y offset of the plot from the bottom side of the plot frame (any subdivision of the display area). This is expressed as a percentage of the Y-dimension of the plot frame.
subpage_x_length (number, default: 100) – Specifies the X length of the plot. This is expressed as a percentage of the X-dimension of the plot frame. Hence the sum of this X length plus the X offset cannot exceed 100 (it is advised that it does not exceed 95 since you need some margin on the right for things like axis or map grid labels).
subpage_y_length (number, default: 100) – Same as
subpage_x_lengthbut for the Y length of the plot.page_frame ({"on", "off"}, default: "off") – Toggles the plotting of a border line around the plot frame.
page_frame_colour (str, default: "charcoal") – Colour of the page frame. Available when
page_frameis “on”.page_frame_line_style ({"solid", "dot", "dash", "chain_dot", "chain_dash"}, default: "solid") – Line style of the page frame. Available when
page_frameis “on”.page_frame_thickness (number, default: 2) – Line thickness of the page frame. Available when
page_frameis “on”.page_id_line ({"on", "off"}, default: "off") – Toggles the plotting of plot identification line.
page_id_line_user_text (str) – Specifies user text to be added to the plot identification line. Only available when
page_id_lineis “on”.subpage_frame ({"on", "off"}, default: "off") – Toggles the plotting of a border line around the plot itself. In most cases you will want this to be left “on”. When “off” the sides of the plot not equipped with axis will not be plotted.
subpage_frame_colour (str, default: "black") – Colour of the subpage frame. Available when
subpage_frameis “on”.subpage_frame_line_style ({"solid", "dot", "dash", "chain_dot", "chain_dash"}, default: "solid") – Line style of the subpage frame. Available when
subpage_frameis “on”.subpage_frame_thickness (int, default: 2) – Line thickness of the subpage frame. Available when
subpage_frameis “on”.subpage_background_colour (str, default: "white") – Specifies the colour of the background of the plot (i.e. not affected by visual definitions like contour shadings or lines).
- Return type
Request

