Note
Click here to download the full example code
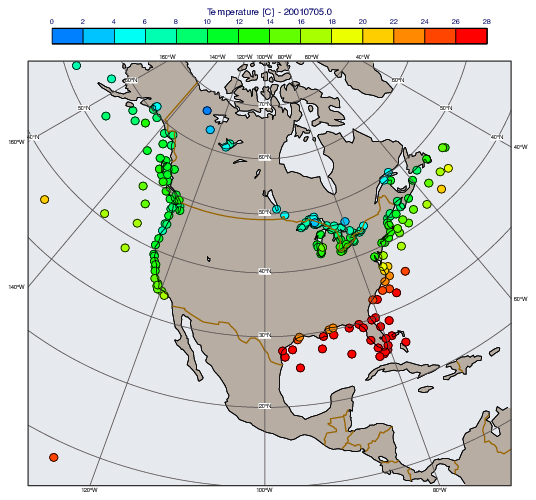
NetCDF - Marine Observations
# (C) Copyright 2017- ECMWF.
#
# This software is licensed under the terms of the Apache Licence Version 2.0
# which can be obtained at http://www.apache.org/licenses/LICENSE-2.0.
#
# In applying this licence, ECMWF does not waive the privileges and immunities
# granted to it by virtue of its status as an intergovernmental organisation
# nor does it submit to any jurisdiction.
#

import metview as mv

# read maritime observations
# data available at: https://www.unidata.ucar.edu/software/netcdf/examples/files.html
filename = "madis-maritime.nc"
if mv.exist(filename):
    nc = mv.read(filename)
else:
    nc = mv.gallery.load_dataset(filename)

# This netCDF has the following structure:
#
# dimensions:
# 	...
# 	recNum = UNLIMITED ; // (405 currently
# variables:
#   float latitude(recNum) ;
# 	float longitude(recNum) ;
#   float temperature(recNum) ;
# 		temperature:long_name = "temperature" ;
# 		temperature:units = "kelvin" ;

# convert the temperature variable from K -> C
# store the result in a new netCDF object
mv.setcurrent(nc, "temperature")
nc_t = nc - 273.16

# define netcdf plotting
vis = mv.netcdf_visualiser(
    netcdf_plot_type="geo_points",
    netcdf_latitude_variable="latitude",
    netcdf_longitude_variable="longitude",
    netcdf_value_variable="temperature",
    netcdf_data=nc_t,
)

# define symbol plotting
sym = mv.msymb(
    legend="on",
    symbol_type="marker",
    symbol_table_mode="advanced",
    symbol_outline="on",
    symbol_advanced_table_min_value=0,
    symbol_advanced_table_max_value=28,
    symbol_advanced_table_level_count=14,
    symbol_advanced_table_max_level_colour="red",
    symbol_advanced_table_min_level_colour="greenish_blue",
    symbol_advanced_table_colour_direction="clockwise",
    symbol_advanced_table_marker_list=15,
    symbol_advanced_table_height_list=0.6,
)

# define coastlines
coastlines = mv.mcoast(
    map_coastline_land_shade="on",
    map_coastline_land_shade_colour="RGB(0.7188,0.6798,0.6381)'",
    map_coastline_sea_shade="on",
    map_coastline_sea_shade_colour="RGB(0.9002,0.9147,0.9351)",
    map_boundaries="on",
    map_boundaries_colour="mustard",
    map_boundaries_thickness=2,
    map_grid_colour="RGB(0.337,0.314,0.314)",
)

# define geographical view
view = mv.geoview(
    map_projection="polar_stereographic",
    map_area_definition="corners",
    area=[4.01, -126.23, 42.52, -22.9],
    map_vertical_longitude=-100,
    coastlines=coastlines,
)

# define legend
legend = mv.mlegend(legend_text_font_size=0.3)

# define title - get date from the netCDF metadata
title = mv.mtext(
    text_lines=["Temperature [C] - " + str(mv.global_attributes(nc_t).get("cdlDate"))],
    text_font_size=0.4,
)

# define output
mv.setoutput(mv.pdf_output(output_name="nc_maritime_obs"))

# generate plot
mv.plot(view, vis, sym, legend, title)