Note
Click here to download the full example code
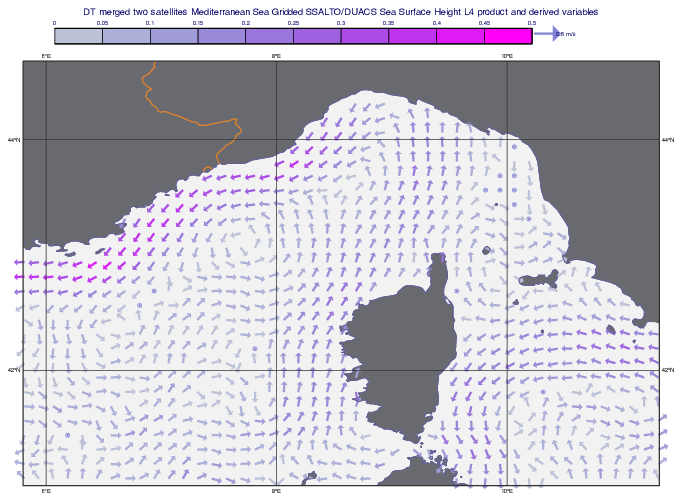
NetCDF - Sea Currents with Fix-sized Vectors
# (C) Copyright 2017- ECMWF.
#
# This software is licensed under the terms of the Apache Licence Version 2.0
# which can be obtained at http://www.apache.org/licenses/LICENSE-2.0.
#
# In applying this licence, ECMWF does not waive the privileges and immunities
# granted to it by virtue of its status as an intergovernmental organisation
# nor does it submit to any jurisdiction.
#

import metview as mv

# read NetCDF file with gridded data over the Mediterranean Sea
filename = "sea_current.nc"
if mv.exist(filename):
    nc = mv.read(filename)
else:
    nc = mv.gallery.load_dataset(filename)


# this NetCDF data has the following structure:

# dimensions:
# 	time = 1 ;
# 	latitude = 128 ;
# 	longitude = 344 ;
# 	nv = 2 ;
# variables:
#   float time(time) ;
# 	float latitude(latitude) ;
# 	float longitude(longitude) ;
#   int ugos(time, latitude, longitude) ;
# 		ugos:long_name = "Absolute geostrophic velocity: zonal component" ;
# 	int vgos(time, latitude, longitude) ;
# 		vgos:long_name = "Absolute geostrophic velocity: meridian component" ;


# define netcdf plotting based on the data structure above
vis = mv.netcdf_visualiser(
    netcdf_plot_type="geo_matrix_vectors",
    netcdf_latitude_variable="latitude",
    netcdf_longitude_variable="longitude",
    netcdf_x_component_variable="ugos",
    netcdf_y_component_variable="vgos",
    netcdf_data=nc,
)

# define vector plotting using fix-sized arrow
vector_plotting = mv.mwind(
    wind_thinning_factor=1,
    legend="on",
    wind_advanced_method="on",
    wind_advanced_colour_max_value=0.5,
    wind_advanced_colour_min_value=0,
    wind_advanced_colour_max_level_colour="RGB(1,0.003922,0.9668)",
    wind_advanced_colour_min_level_colour="RGB(0.7359,0.7584,0.8484)",
    wind_arrow_calm_indicator="on",
    wind_arrow_calm_below=0.01,
    wind_arrow_colour="RGB(0.5124,0.5124,0.8366)",
    wind_arrow_head_shape=1,
    wind_arrow_head_ratio=1,
    wind_arrow_fixed_velocity=1,
    wind_arrow_thickness=2,
    wind_arrow_unit_velocity=2.6,
)


# define coastlines
coastlines = mv.mcoast(
    map_coastline_colour="RGB(0.3628,0.3557,0.5698)",
    map_coastline_land_shade="on",
    map_coastline_land_shade_colour="RGB(0.4119,0.4173,0.4352)",
    map_coastline_sea_shade="on",
    map_coastline_sea_shade_colour="RGB(0.95,0.95,0.95)",
    map_boundaries="on",
    map_boundaries_colour="RGB(0.8809,0.5136,0.1701)",
    map_boundaries_thickness=2,
    map_grid_colour="charcoal",
    map_grid_latitude_increment=2,
    map_grid_longitude_increment=2,
)


# define map view
view = mv.geoview(
    map_area_definition="corners", area=[41, 5.8, 44.68, 11.32], coastlines=coastlines
)

# define title
title = mv.mtext(text_font_size=0.4)

# define legend
legend = mv.mlegend(legend_text_font_size=0.25)

# define output
mv.setoutput(mv.pdf_output(output_name="nc_seacurrent_fixed_vector"))

# generate plot
mv.plot(view, vis, vector_plotting, legend, title)