Note
Click here to download the full example code
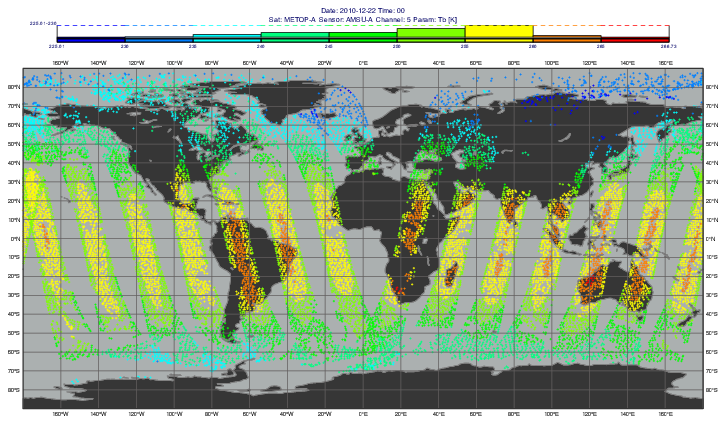
ODB - AMSU-A Radiance Map
# (C) Copyright 2017- ECMWF.
#
# This software is licensed under the terms of the Apache Licence Version 2.0
# which can be obtained at http://www.apache.org/licenses/LICENSE-2.0.
#
# In applying this licence, ECMWF does not waive the privileges and immunities
# granted to it by virtue of its status as an intergovernmental organisation
# nor does it submit to any jurisdiction.
#

import metview as mv

# read ODB
filename = "amsua.odb"
if mv.exist(filename):
    amsua_odb = mv.read(filename)
else:
    amsua_odb = mv.gallery.load_dataset(filename)

# define channel
channel = 5  # 5,6

# filter channel and define plot data
vis = mv.odb_visualiser(
    odb_where="vertco_reference_1@body = " + str(channel), odb_data=amsua_odb
)

# find out value range
f = mv.odb_filter(
    odb_query="select obsvalue@body as val where vertco_reference_1@body = "
    + str(channel),
    odb_data=amsua_odb,
)

val = mv.values(f, "val")
v1 = mv.minvalue(val)
v2 = mv.maxvalue(val)

# symbol plotting (adjusted to the actual min and max)
symbol_fixed = mv.msymb(
    legend="on",
    symbol_type="marker",
    symbol_table_mode="advanced",
    symbol_advanced_table_selection_type="interval",
    symbol_advanced_table_min_value=v1,
    symbol_advanced_table_max_value=v2,
    symbol_advanced_table_interval=5,
    symbol_advanced_table_max_level_colour="red",
    symbol_advanced_table_min_level_colour="blue",
    symbol_advanced_table_colour_direction="clockwise",
    symbol_advanced_table_marker_list=3,
    symbol_advanced_table_height_list=0.15,
)

# coastlines
coast = mv.mcoast(
    map_coastline_colour="RGB(0.5,0.5,0.5)",
    map_coastline_resolution="low",
    map_coastline_land_shade="on",
    map_coastline_land_shade_colour="RGB(0.21,0.21,0.21)",
    map_coastline_sea_shade="on",
    map_coastline_sea_shade_colour="RGB(0.67,0.69,0.69)",
    map_grid_colour="RGB(0.38,0.37,0.37)",
)

# legend with histogram
legend = mv.mlegend(legend_display_type="histogram")

# title
title = mv.mtext(
    text_line_count=2,
    text_line_1="Date: 2010-12-22 Time: 00",
    text_line_2="Sat: METOP-A  Sensor: AMSU-A  Channel: "
    + str(channel)
    + " Param: Tb [K]",
)

# define the output plot file
mv.setoutput(mv.pdf_output(output_name="odb_radiance"))

# plot
mv.plot(coast, vis, symbol_fixed, legend, title)