Note
Click here to download the full example code
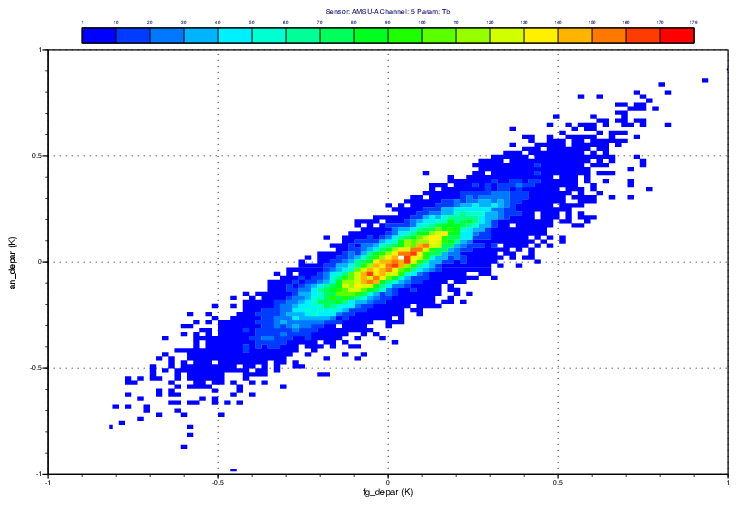
ODB - Scatterplot with Binning
# (C) Copyright 2017- ECMWF.
#
# This software is licensed under the terms of the Apache Licence Version 2.0
# which can be obtained at http://www.apache.org/licenses/LICENSE-2.0.
#
# In applying this licence, ECMWF does not waive the privileges and immunities
# granted to it by virtue of its status as an intergovernmental organisation
# nor does it submit to any jurisdiction.
#

# ------------------------------------------------------------------
# Demonstrates how to generate a scatterpot from ODB
# using binning.
# ------------------------------------------------------------------

import metview as mv

use_mars = False
if use_mars:
    #  retrieve from MARS - for AMSUA channel 5 (all satellites)
    db = mv.retrieve(
        type="mfb",
        repres="bu",
        obsgroup="amsua",
        time=00,
        date=-2,
        filter="select an_depar@body,fg_depar@body " + "where vertco_reference_1=5",
    )
else:
    filename = "amsua.odb"
    if mv.exist(filename):
        db = mv.read(filename)
    else:
        db = mv.gallery.load_dataset(filename)

# Define binning - with 100 bins both in the horizontal and vertical axes
bin_100 = mv.binning(binning_x_count=100, binning_y_count=100)

# Define visualiser for scatterplot with binning
bin_plot = mv.odb_visualiser(
    odb_plot_type="xy_binning",
    odb_x_variable="fg_depar@body",
    odb_y_variable="an_depar@body",
    odb_value_variable="",
    # odb_where          = "vertco_reference_1@body =5 ",
    odb_data=db,
    odb_binning=bin_100,
)

# Define grid shading - the binned dataset will be defined on a grid
bin_grid_shade = mv.mcont(
    legend="on",
    contour="off",
    contour_min_level=1,
    contour_shade_min_level=1,
    contour_level_count=20,
    contour_shade="on",
    contour_shade_technique="grid_shading",
    contour_shade_method="area_fill",
    contour_shade_max_level_colour="red",
    contour_shade_min_level_colour="blue",
    contour_shade_colour_direction="clockwise",
)

# Define title
title = mv.mtext(text_line_count=1, text_line_1="Sensor: AMSU-A  Channel: 5 Param: Tb")

# Define horizontal axis
hor_axis = mv.maxis(
    axis_position="left",
    axis_title_text="fg_depar (K)",
    axis_tick_interval=0.5,
    axis_minor_tick="on",
    axis_minor_tick_count=4,
    axis_grid="on",
    axis_grid_colour="black",
    axis_grid_line_style="dot",
)

# Define vertical axis
ver_axis = mv.maxis(
    axis_orientation="vertical",
    axis_title_text="an_depar (K)",
    axis_tick_interval=0.5,
    axis_minor_tick="on",
    axis_minor_tick_count=4,
    axis_grid="on",
    axis_grid_colour="black",
    axis_grid_line_style="dot",
)

# Define Catresian view
scatter_view = mv.cartesianview(
    x_min=-1,
    x_max=1,
    y_min=-1,
    y_max=1,
    subpage_y_position=12.5,
    subpage_y_length=75,
    horizontal_axis=hor_axis,
    vertical_axis=ver_axis,
)


# define the output plot file
mv.setoutput(mv.pdf_output(output_name="odb_scatterplot_binning"))

# Plot
mv.plot(scatter_view, bin_plot, bin_grid_shade, title)