cartesianview

Defines a projection for a Cartesian-style coordinate system. This should be used for any plot which is not to be displayed on a map. Once the projection has been defined through the axis specification, data points should be provided in this coordinate system. For further details on the role and usage of views in the visualisation process, please see Analysis Views.
Note
This function performs the same task as the Cartesian View icon in Metview’s user interface. It accepts its parameters as keyword arguments, described below.
- cartesianview(**kwargs)
Defines the view for a Cartesian-style coordinate system.
- Parameters
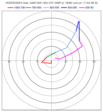
map_projection ({"cartesian", "tephigram", "skewt", "emagram", "taylor"}, default: "cartesian") – Specifies the plot type.
x_automatic ({"on", "off"}, default: "off") – Determines whether the x-coordinate system should be defined automatically based on the first data to be plotted in the view; if so, the axis will range, left to right, from the minimum to the maximum value in the data. If not, the minimum and maximum values should be specified.
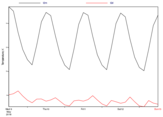
x_axis_type ({"regular", "date", "logarithmic", "geoline"}, default: "regular") –
Determines the type of coordinates on this axis:
”regular”: the values are numbers
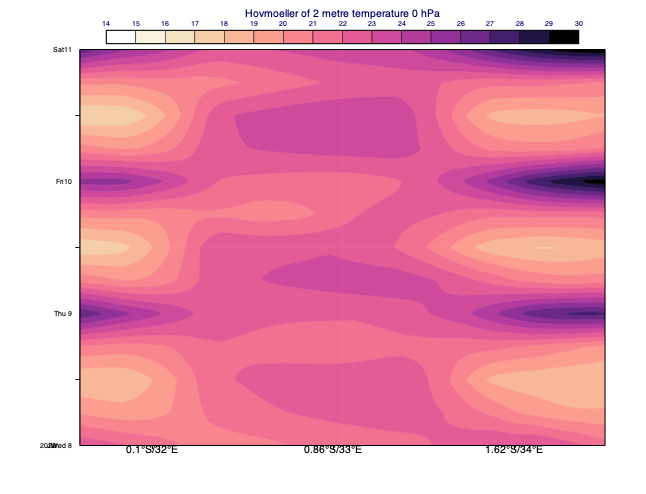
”date” : the values are dates.
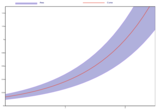
”logarithmic”: the values are numbers, but the axis will be displayed on a logarithmic scale
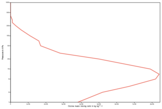
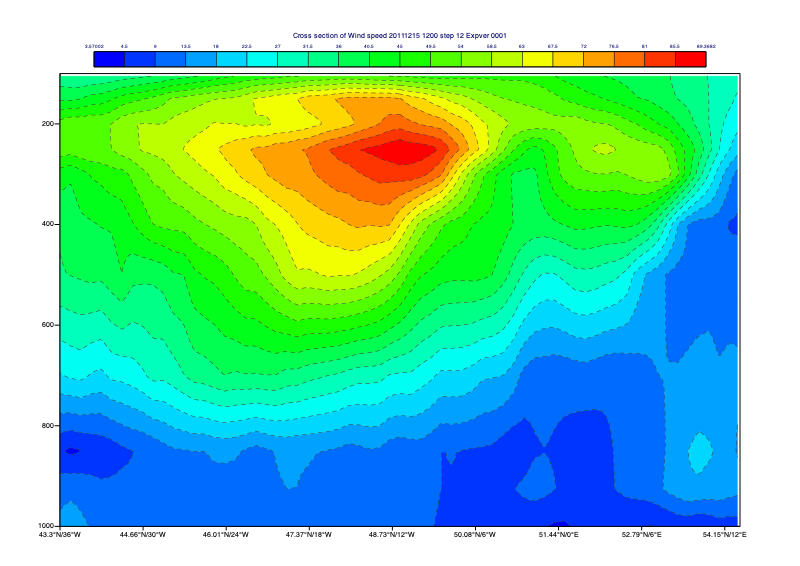
”geoline”: the axis limits should be provided as geographical coordinates; this can be used for displaying cross sections, or other plots where an axis represents a geographical line
x_min (number, default: 0) – The leftmost value of the x axis, this parameter is only used if
x_axis_typeis set to “regular” or “logarithmic”.x_max (number, default: 100) – The rightmost value of the x axis, this parameter is only used if
x_axis_typetype is set to “regular” or “logarithmic”.x_min_latitude (number, default: -90) – The leftmost latitude value of the x axis, this parameter is only used if
x_axis_typeis set to “geoline”.x_max_latitude (number, default: 90) – The rightmost latitude value of the x axis, this parameter is only used if
x_axis_typeis set to “geoline”.x_min_longitude (number, default: -180) – The leftmost longitude value of the x axis, this parameter is only used if
x_axis_typeis set to “geoline”.x_max_longitude (number, default: 180) – The rightmost longitude value of the x axis, this parameter is only used if
x_axis_typeis set to “geoline”.x_date_min (str, default: "2011-01-01") – The leftmost date value of the x axis, this parameter is only used if
x_axis_typeis set to “date”.x_date_max (str, default: "2011-01-31") – The rightmost date value of the x axis, this parameter is only used if
x_axis_typeis set to “date”.x_automatic_reverse ({"on", "off"}, default: "off") –
y_automatic ({"on", "off"}, default: "off") – Determines whether the y-coordinate system should be defined automatically based on the first data to be plotted in the view; if so, the axis will range, left to right, from the minimum to the maximum value in the data. If not, the minimum and maximum values should be specified.
y_axis_type ({"regular", "date", "logarithmic", "geoline"}, default: "regular") –
Determines the type of coordinates on this axis:
”regular”: the values are numbers
”date” : the values are dates.
”logarithmic”: the values are numbers, but the axis will be displayed on a logarithmic scale
”geoline”: the axis limits should be provided as geographical coordinates; this can be used for displaying cross sections, or other plots where an axis represents a geographical line
y_min (number, default: 0) – The bottom value of the y axis, this parameter is only used if
y_axis_typeis set to “regular” or “logarithmic”.y_max (number, default: 100) – The uppermost value of the y axis, this parameter is only used if
y_axis_typeis set to “regular” or “logarithmic”.y_min_latitude (number, default: -90) – The bottom latitude value of the y axis, this parameter is only used if
y_axis_typeis set to “geoline”.y_max_latitude (number, default: 90) – The uppermost latitude value of the y axis, this parameter is only used if
y_axis_typeis set to “geoline”.y_min_longitude (number, default: -180) – The bottom longitude value of the y axis, this parameter is only used if
y_axis_typeis set to “geoline”.y_max_longitude (number, default: 180) – The uppermost longitude value of the x axis, this parameter is only used if
y_axis_typeis set to “geoline”.y_date_min (str, default: "2011-01-01") – The bottom date value of the y axis, this parameter is only used if
y_axis_typeis set to “date”.y_date_max (str, default: "2011-01-31") – The uppermost date value of the y axis, this parameter is only used if
y_axis_typeis set to “date”.y_automatic_reverse ({"on", "off"}, default: "off") –
horizontal_axis (
maxis()) – Specifies the plotting attributes of the horizontal axis.vertical_axis (
maxis()) – Specifies the plotting attributes of the vertical axis.taylor_grid (:func:`mtaylor) – Specifies the plotting attributes of Taylor grid when
map_projectionis “taylor”.subpage_clipping ({"on", "off"}, default: "off") – Clips plot to subpage borders.
subpage_x_position (number, default: 7.5) – Specifies the X offset of the plot from the left side of the plot frame (any subdivision of the display area). This is expressed as a percentage of the X-dimension of the plot frame.
subpage_y_position (number, default: 7) – Specifies the Y offset of the plot from the bottom side of the plot frame (any subdivision of the display area). This is expressed as a percentage of the Y-dimension of the plot frame.
subpage_x_length (number, default: 85) – Specifies the X length of the plot. This is expressed as a percentage of the X-dimension of the plot frame. Hence the sum of this X length plus the X offset cannot exceed 100 (it is advised that it does not exceed 95 since you need some margin on the right for things like axis or map grid labels).
subpage_y_length (number, default: 80) – Same as
subpage_x_lengthbut for the Y length of the plot.subpage_vertical_axis_width (str, default: "1") –
subpage_horizontal_axis_height (str, default: "1") –
page_frame ({"on", "off"}, default: "off") – Toggles the plotting of a border line around the plot frame.
page_frame_colour (str, default: "charcoal") – Colour of the page frame. Available when
page_frameis “on”.page_frame_line_style ({"solid", "dot", "dash", "chain_dot", "chain_dash"}, default: "solid") – Line style of the page frame. Available when
page_frameis “on”.page_frame_thickness (number, default: 2) – Line thickness of the page frame. Available when
page_frameis “on”.page_id_line ({"on", "off"}, default: "off") – Toggles the plotting of plot identification line.
page_id_line_user_text (str) – Specifies user text to be added to the plot identification line. Only available when
page_id_lineis “on”.subpage_frame ({"on", "off"}, default: "off") – Toggles the plotting of a border line around the plot itself. In most cases you will want this to be left “on”. When “off” the sides of the plot not equipped with axis will not be plotted.
subpage_frame_colour (str, default: "black") – Colour of the subpage frame. Available when
subpage_frameis “on”.subpage_frame_line_style ({"solid", "dot", "dash", "chain_dot", "chain_dash"}, default: "solid") – Line style of the subpage frame. Available when
subpage_frameis “on”.subpage_frame_thickness (int, default: 2) – Line thickness of the subpage frame. Available when
subpage_frameis “on”.subpage_background_colour (str, default: "white") – Specifies the colour of the background of the plot (i.e. not affected by visual definitions like contour shadings or lines).
- Return type
Request