Note
Click here to download the full example code
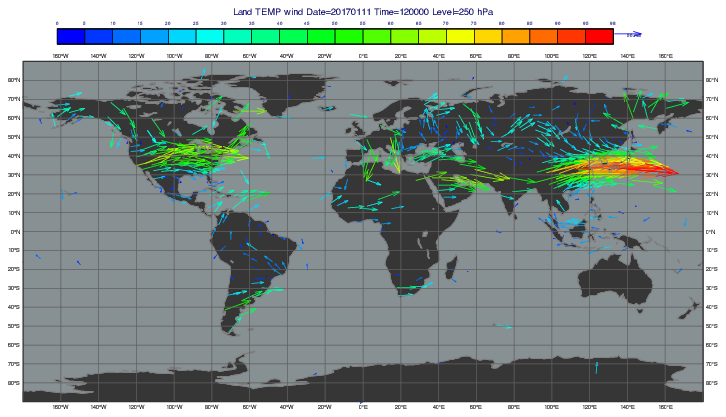
ODB - TEMP Wind
# (C) Copyright 2017- ECMWF.
#
# This software is licensed under the terms of the Apache Licence Version 2.0
# which can be obtained at http://www.apache.org/licenses/LICENSE-2.0.
#
# In applying this licence, ECMWF does not waive the privileges and immunities
# granted to it by virtue of its status as an intergovernmental organisation
# nor does it submit to any jurisdiction.
#

import metview as mv

# -------------------------------------------------------------------------
# Demonstrates how to plot TEMP wind data from ODB onto a map
# ------------------------------------------------------------------------

# read db
filename = "temp.odb"
if mv.exist(filename):
    db = mv.read(filename)
else:
    db = mv.gallery.load_dataset(filename)

# define pressure level
lev = 250

# define query for u wind component
q_u = """select lat@hdr as lat,
       lon@hdr as lon,
       obsvalue as val
      where varno=3 and vertco_reference_1={}""".format(
    lev * 100
)

# define query for v wind component
q_v = """select lat@hdr as lat,
       lon@hdr as lon,
       obsvalue as val
      where varno=4 and vertco_reference_1={}""".format(
    lev * 100
)

# define query for metadata
q_meta = "select DISTINCT andate, antime"

# filter u
f_u = mv.odb_filter(odb_query=q_u, odb_data=db)

# filter v
f_v = mv.odb_filter(odb_query=q_v, odb_data=db)

# filter metadata
f_m = mv.odb_filter(odb_query=q_meta, odb_data=db)

# read the odb columns int vectors
lat = mv.values(f_u, "lat")
lon = mv.values(f_u, "lon")
u = mv.values(f_u, "val")
v = mv.values(f_v, "val")

# read values for the title
andate = mv.values(f_m, "andate")[0]
antime = mv.values(f_m, "antime")[0]

# create gepoints from the odb data
gpt = mv.create_geo(
    type="xy_vector", latitudes=lat, longitudes=lon, levels=lev, values=u, value2s=v
)

# define wind plotting style
colour_wind = mv.mwind(
    legend="on",
    wind_advanced_method="on",
    wind_arrow_unit_velocity=50.0,
    wind_thinning_factor=1.0,
    wind_advanced_colour_selection_type="interval",
    wind_advanced_colour_level_interval=5,
    wind_advanced_colour_min_value=0,
    wind_advanced_colour_max_level_colour="red",
    wind_advanced_colour_min_level_colour="blue",
    wind_advanced_colour_direction="clockwise",
)


# define coastlines
coast = mv.mcoast(
    map_coastline_colour="RGB(0.5,0.5,0.5)",
    map_coastline_resolution="low",
    map_coastline_land_shade="on",
    map_coastline_land_shade_colour="RGB(0.21,0.21,0.21)",
    map_coastline_sea_shade="on",
    map_coastline_sea_shade_colour="RGB(0.53,0.57,0.58)",
    map_grid_colour="RGB(0.38,0.37,0.37)",
)


# define title
title = mv.mtext(
    text_font_size=0.4,
    text_line_1="Land TEMP wind Date={:.0f} Time={:.0f} Level={:.0f} hPa".format(
        andate, antime, lev
    ),
)


# define the output plot file
mv.setoutput(mv.pdf_output(output_name="odb_temp_wind"))

# generate the plot
mv.plot(coast, gpt, colour_wind, title)