Note
Click here to download the full example code
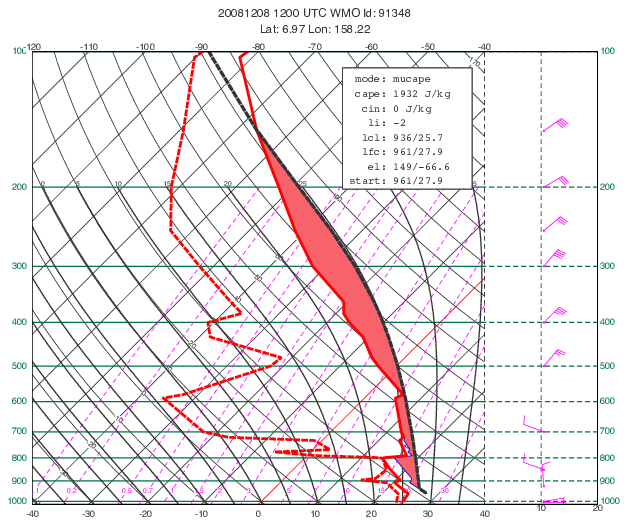
BUFR - Parcel Path on Skew-T
# (C) Copyright 2017- ECMWF.
#
# This software is licensed under the terms of the Apache Licence Version 2.0
# which can be obtained at http://www.apache.org/licenses/LICENSE-2.0.
#
# In applying this licence, ECMWF does not waive the privileges and immunities
# granted to it by virtue of its status as an intergovernmental organisation
# nor does it submit to any jurisdiction.
#

import metview as mv

# Note: at least Metview version 5.17.0 is required


def build_title_text(prof):
    """
    Utility function to generate text for plot title
    """

    # get profile info for title
    info = mv.thermo_data_info(prof)

    # obs
    if "station" in info:
        t1 = "{} {} UTC WMO Id: {}".format(
            int(info["date"]), int(info["time"]), int(info["station"])
        )
    # fc or an
    else:
        t1 = "Run: {} UTC +{}h Valid: {} UTC".format(
            info["base_date"].strftime("%Y-%m-%d %H"),
            int(info["step"]),
            info["valid_date"].strftime("%Y-%m-%d %H"),
        )

    t2 = "Lat: {:.2f} Lon: {:.2f}".format(info["lat"], info["lon"])
    return [t1, t2]


def build_box_text(p):
    """
    Utility function to generate text for parcel info box
    """

    def _add_row(label, val, units=""):
        t = "{:>7} ".format(label + ":")
        if val is None:
            t += "-"
        elif isinstance(val, str):
            t += "{:<}".format(val)
        else:
            t += "{:.0f} {}".format(val, units)
        return t

    def _add_row_pt(label, val):
        t = "{:>7} ".format(label + ":")
        if val is None or not isinstance(val, dict):
            t += "-"
        else:
            t += "{:.0f}/{:.1f}".format(val["p"], val["t"])
        return t

    t = []
    t.append("{:>7} {:<10}".format("mode:", p["start"]["mode"]))
    t.append(_add_row("cape", p.get("cape"), "J/kg"))
    t.append(_add_row("cin", p.get("cin"), "J/kg"))
    t.append(_add_row("li", p.get("li"), ""))
    t.append(_add_row_pt("lcl", p.get("lcl")))
    t.append(_add_row_pt("lfc", p.get("lfc")))
    t.append(_add_row_pt("el", p.get("el")))
    t.append(_add_row_pt("start", p.get("start")))

    return t


# read BUFR data
filename = "temp.bufr"
if mv.exist(filename):
    bf = mv.read(filename)
else:
    bf = mv.gallery.load_dataset(filename)

# extract thermo profile for a given station
prof = mv.thermo_bufr(data=bf, station=mv.stations(search_key="ident", ident=91348))

# compute parcel path
parcel = mv.thermo_parcel_path(prof, mode="mucape", layer_depth=300)

# create plot object for parcel areas
parcel_area = mv.thermo_parcel_area(parcel)

# create plot object for parcel path
parcel_vis = mv.xy_curve(parcel["t"], parcel["p"], "charcoal", "dash", 6)

# define t and td profile style
prof_vis = mv.mthermo(
    thermo_temperature_line_thickness=5,
    thermo_temperature_missing_data_thickness=5,
    thermo_dewpoint_line_thickness=5,
    thermo_dewpoint_missing_data_thickness=5,
)

# define wind plotting style
prof_wind_style = mv.mwind(
    wind_thinning_factor=1,
    wind_field_type="flags",
    wind_flag_colour="magenta",
    wind_flag_length=0.8,
    wind_flag_origin_marker="dot",
    wind_flag_origin_marker_size=0.2,
)


# define thermo grid
thermo_grid = mv.mthermogrid(
    thermo_isotherm_label_font_size=0.4, thermo_isobar_label_font_size=0.4
)

# define the thermodynamic view
view = mv.thermoview(
    type="skewt",
    minimum_temperature=-120,
    maximum_temperature=40,
    top_pressure=100,
    thermo_grid=thermo_grid,
    subpage_clipping="ON",
)

# get profile info for title
info = mv.thermo_data_info(prof)

# define title
title_txt = build_title_text(prof)
title = mv.mtext(text_lines=title_txt, text_font_size=0.5, text_colour="charcoal")

# define text lines for info box
txt = build_box_text(parcel)

# create info box - ensure font is monospace
info_box = mv.mtext(
    text_lines=txt,
    text_font="courier",
    text_font_size=0.45,
    text_colour="charcoal",
    text_justification="left",
    text_mode="positional",
    text_box_x_position=15.1,
    text_box_y_position=13.8,
    text_box_x_length=4.8,
    text_box_y_length=len(txt) * 0.5 + 0.5,
    text_box_blanking="on",
    text_border="on",
    text_border_colour="charcoal",
)

# define the output plot file
mv.setoutput(mv.pdf_output(output_name="parcel_path_from_bufr"))

# plot the profile, parcel areas, parcel path and info box together
mv.plot(view, parcel_area, prof, prof_vis, prof_wind_style, parcel_vis, title, info_box)