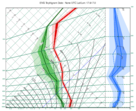
thermoview

Specifies the view for a thermodynamic diagram.
A suitable Fieldset (GRIB), Bufr or input_visualiser() data can be directly plotted into a thermoview(), the necessary profiles will be automatically extracted from the input data. On top of that thermo_bufr() and thermo_grib() objects can be also visualised in a thermoview().
When using thermoview() the generated profile data cannot be accessed. If you need to access this data use thermo_bufr() or thermo_grib() instead.
For further details on the role and usage of views in the visualisation process, please see Anaylis Views.
Note
This function performs the same task as the Thermo View icon in Metview’s user interface. It accepts its parameters as keyword arguments, described below.
- thermoview(**kwargs)
Specifies the view for a thermodynamic diagram.
- Parameters
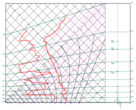
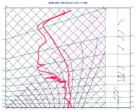
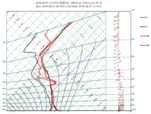
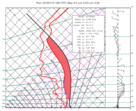
type ({"tephigram", "skewt", "emagram"}, default: "tephigram") – Specifies the type of the thermodynamic diagram to be produced.
bottom_pressure (number, default: 1015.0) – Specifies the value (hPa) at the bottom of the pressure axis of the thermodynamic diagram.
top_pressure (number, default: 100) – Specifies the value (hPa) at the top of the pressure axis of the thermodynamic diagram.
minimum_temperature (number, default: -90) – Specifies the minimum value (Celsius) on the temperature axis of the thermodynamic diagram.
maximum_temperature (number, default: 50) – Specifies the maximum value (Celsius) on the temperature axis of the thermodynamic diagram.
thermo_grid (
mthermogrid()) – Configures the background attributes of the thermodynamic diagram.point_selection ({"coordinates", "area_average", "wmo_name", "wmo_ident", "wigos", "station"}, default: "coordinates") –
Specifies the geographical location selection mode. The possible values are as follows:
coordinates: use lat/lon coordinates
area_average: [GRIB only] average in a geographical area
wmo_name: [BUFR only] use the WMO station name from stationOrSiteName ecCodes BUFR key
wmo_ident: [BUFR only] use the WMO station identifier as blockNumber*1000+stationNumber
wigos: [BUFR only] use the WIGOS Station Identifier. This is made up of four values (blocks) represented by
wigos_series,wigos_issuer,wigos_issue_numberandwigos_local_name.station: use a
stations()object
coordinates (list, default: [0, 0]) – Specifies the geographical location (as [lat, lon]) for which the diagram is to be plotted. Available when
point_selectionis “coordinates”. When BUFR data is used all the stations within thethresholdaround this location will be selected.threshold (number, default: 0.1) – [BUFR only] Specifies the threshold in degrees (both in lat and lon) for selecting the matching station(s) for the specified coordinates. Available when
point_selectionis “coordinates”. New in Metview version 5.17.0area_average (list, default: [30, -30, -30, 30]) – [GRIB only] Specifies a geographical area over which an area average value will be used, instead of a point value, to produce the diagram. The area is defined as [north, west, south, east]. Available when
point_selectionis “area_average”.wmo_name (str) – [BUFR only] Specifies the WMO name of the station to be selected by using the stationOrSiteName ecCodes BUFR key from the data section of the messages. Name matching is case insensitive with leading and trailing spaces omitted. Available when
point_selectionis “wmo_name”. New in Metview version 5.17.0wmo_ident (number, default: -1) – [BUFR only] Specifies the numeric WMO identifier of the station to be selected. This is the combination of the WMO block and station number in the form of blockNumber*1000+stationNumber. These numbers are extracted from the data section of the BUFR message using the corresponding ecCodes keys. Available when
point_selectionis “wmo_ident”. New in Metview version 5.17.0wigos_series (number, default: -q) – [BUFR only] Specifies the WIGOS Identifier Series represented by the wigosIdentifierSeries ecCodes key in the BUFR message. The default value (-1) means that this parameter is not used in the WIGOS Station Identifier matching. Available when
point_selectionis “wigos”. New in Metview version 5.17.0 .wigos_issuer (number, default: -1) – [BUFR only] Specifies the WIGOS Issuer of Identifier represented by the wigosIssuerOfIdentifier ecCodes key in the BUFR message. The default value (-1) means that this parameter is not used in the WIGOS Station Identifier matching. Available when
point_selectionis “wigos”. New in Metview version 5.17.0 .wigos_issue_number (number, default: -1) – [BUFR only] Specifies the WIGOS Issue Number represented by the wigosIssueNumber ecCodes key in the BUFR message. The default value (-1) means that this parameter is not used in the WIGOS Station Identifier matching. Available when
point_selectionis “wigos”. New in Metview version 5.17.0 .wigos_local_name (str) – [BUFR only] Specifies the WIGOS Local Identifier name represented by the wigosLocalIdentifierCharacter ecCodes key in the BUFR message. The default value (empty string) means that this parameter is not used in the WIGOS Station Identifier matching. Available when
point_selectionis “wigos”. New in Metview version 5.17.0 .station (
stations`()) – Specifies the location as astations()object for which the diagram is to be plotted. Available ifpoint_selectionis “station”.point_extraction ({"interpolate", "nearest_gridpoint"}, default: "interpolate") –
[GRIB only] Specifies the way to calculate values at the point location for GRIB thermodynamic diagrams. The possible options are:
”interpolate”: interpolate values from the four surrounding grid points.
”nearest_gridpoint”: use the data from the nearest grid point.
Available if
point_selectionis “coordinates”.dew_point_formulation ({"saturation_over_water", "mixed_phase_0_to_-23"}, default: "saturation_over_water") – [GRIB only] Specifies the equation to compute the dew point.
temperature_param (number, default: 130) – [GRIB only] Specifies the ecCodes paramId used to identify the temperature in the input data.
specific_humidity_param (number, default: 133) – [GRIB only] Specifies the ecCodes paramId used to identify the specific humidity in the input data.
lnsp_param (number, default: 152) – [GRIB only] Specifies the ecCodes paramId used to identify the Logarithm of Surface Pressure (LNSP) in the input data.
u_wind_param (number, default: 131) – [GRIB only] Specifies the ecCodes paramId used to identify the U wind component in the input data.
v_wind_param (number, default: 132) – [GRIB only] Specifies the ecCodes paramId used to identify the V wind component in the input data.
subpage_clipping ({"on", "off"}, default: "off") – Clips plot to subpage borders.
subpage_x_position (number, default: 12) – Specifies the X offset of the plot from the left side of the plot frame (any subdivision of the display area). This is expressed as a percentage of the X-dimension of the plot frame.
subpage_y_position (number, default: 10) – Specifies the Y offset of the plot from the bottom side of the plot frame (any subdivision of the display area). This is expressed as a percentage of the Y-dimension of the plot frame.
subpage_x_length (number, default: 75) – Specifies the X length of the plot. This is expressed as a percentage of the X-dimension of the plot frame. Hence the sum of this X length plus the X offset cannot exceed 100 (it is advised that it does not exceed 95 since you need some margin on the right for things like axis or map grid labels).
subpage_y_length (number, default: 80) – Same as
subpage_x_lengthbut for the Y length of the plot.page_frame ({"on", "off"}, default: "off") – Toggles the plotting of a border line around the plot frame.
page_frame_colour (str, default: "charcoal") – Colour of the page frame. Available when
page_frameis “on”.page_frame_line_style ({"solid", "dot", "dash", "chain_dot", "chain_dash"}, default: "solid") – Line style of the page frame. Available when
page_frameis “on”.page_frame_thickness (number, default: 2) – Line thickness of the page frame. Available when
page_frameis “on”.page_id_line ({"on", "off"}, default: "off") – Toggles the plotting of plot identification line.
page_id_line_user_text (str) – Specifies user text to be added to the plot identification line. Only available when
page_id_lineis “on”.subpage_frame ({"on", "off"}, default: "off") – Toggles the plotting of a border line around the plot itself. In most cases you will want this to be left “on”. When “off” the sides of the plot not equipped with axis will not be plotted.
subpage_frame_colour (str, default: "black") – Colour of the subpage frame. Available when
subpage_frameis “on”.subpage_frame_line_style ({"solid", "dot", "dash", "chain_dot", "chain_dash"}, default: "solid") – Line style of the subpage frame. Available when
subpage_frameis “on”.subpage_frame_thickness (int, default: 2) – Line thickness of the subpage frame. Available when
subpage_frameis “on”.subpage_background_colour (str, default: "white") – Specifies the colour of the background of the plot (i.e. not affected by visual definitions like contour shadings or lines).
- Return type
Request