Note
Click here to download the full example code
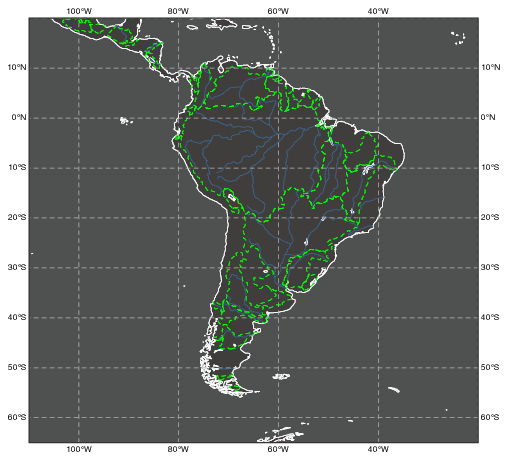
Custom Shapefile Map Layer with Major River Basins
# (C) Copyright 2017- ECMWF.
#
# This software is licensed under the terms of the Apache Licence Version 2.0
# which can be obtained at http://www.apache.org/licenses/LICENSE-2.0.
#
# In applying this licence, ECMWF does not waive the privileges and immunities
# granted to it by virtue of its status as an intergovernmental organisation
# nor does it submit to any jurisdiction.
#

import os

import metview as mv

# get shape file containing "major river basins".
# Data source: https://datacatalog.worldbank.org/dataset/major-river-basins-world
# Data license: CC-BY 4.0

# Note: shape file data consists of several files stored in a single
# zip file for this example!
shape_file = os.path.join(os.getcwd(), "Major_Basins_of_the_World.shp")
if not mv.exist(shape_file):
    mv.gallery.load_dataset("major_basins_of_the_world_0_0_0.zip")

# define coastlines
# Note: "map_user_layer_name" should be set to the full path of the
# shape files without ".shp" suffix!
coast = mv.mcoast(
    map_coastline_colour="white",
    map_coastline_resolution="medium",
    map_coastline_land_shade="on",
    map_coastline_land_shade_colour="RGB(0.247,0.2443,0.2393)",
    map_coastline_sea_shade="on",
    map_coastline_sea_shade_colour="RGB(0.3088,0.3187,0.3187)",
    map_rivers="on",
    map_rivers_colour="RGB(0.24,0.4,0.56)",
    map_grid_line_style="dash",
    map_grid_colour="grey",
    map_label_height=0.35,
    map_user_layer="on",
    map_user_layer_name=shape_file[:-4],
    map_user_layer_colour="green",
    map_user_layer_style="dash",
)

# define view
view = mv.geoview(
    map_area_definition="corners", area=[20, -110, -65, -20], coastlines=coast
)

# define the output plot file
mv.setoutput(mv.pdf_output(output_name="shape_file_layer"))

# plot the data onto the map
mv.plot(view)