Note
Click here to download the full example code
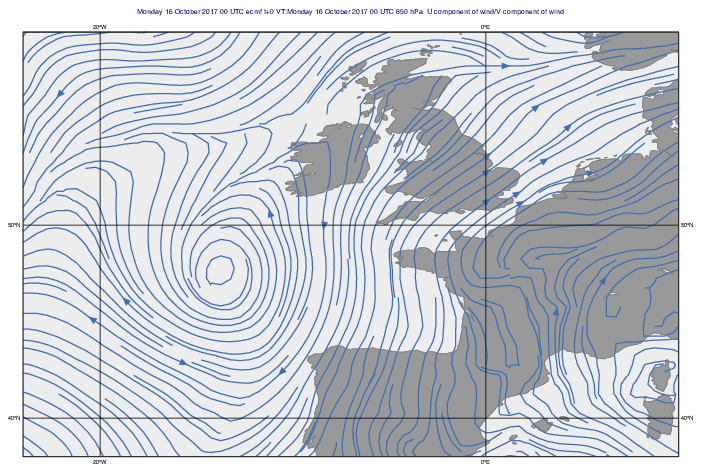
GRIB - Streamlines
# (C) Copyright 2017- ECMWF.
#
# This software is licensed under the terms of the Apache Licence Version 2.0
# which can be obtained at http://www.apache.org/licenses/LICENSE-2.0.
#
# In applying this licence, ECMWF does not waive the privileges and immunities
# granted to it by virtue of its status as an intergovernmental organisation
# nor does it submit to any jurisdiction.
#

import metview as mv

# read grib file - contains only one timestep and level
filename = "advection_850.grib"
if mv.exist(filename):
    f = mv.read(filename)
else:
    f = mv.gallery.load_dataset(filename)

# filter u and v wind components
u = mv.read(data=f, param="u")
v = mv.read(data=f, param="v")

# define coastlines
coast = mv.mcoast(
    map_coastline_land_shade="on",
    map_coastline_land_shade_colour="RGB(0.6,0.6,0.6)",
    map_coastline_sea_shade="on",
    map_coastline_sea_shade_colour="RGB(0.9275,0.9275,0.9313)",
    map_coastline_colour="RGB(0.5,0.5,0.5)",
    map_coastline_resolution="medium",
)

# define the view
view = mv.geoview(
    coastlines=coast, map_area_definition="corners", area=[38, -24, 60, 10]
)

# define wind plotting
wdef = mv.mwind(
    wind_field_type="streamlines",
    wind_streamline_min_density=3,
    wind_streamline_colour="ecmwf_blue",
    wind_streamline_head_ratio=0.4,
)

# define the output plot file
mv.setoutput(mv.pdf_output(output_name="streamline"))

# generate the plot
mv.plot(view, mv.merge(u, v), wdef)