Note
Click here to download the full example code
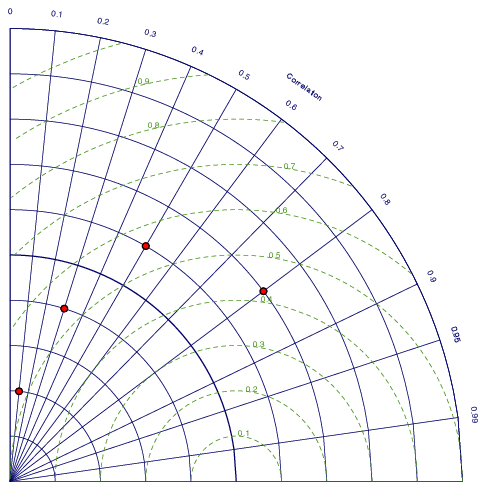
Taylor Diagram
# (C) Copyright 2017- ECMWF.
#
# This software is licensed under the terms of the Apache Licence Version 2.0
# which can be obtained at http://www.apache.org/licenses/LICENSE-2.0.
#
# In applying this licence, ECMWF does not waive the privileges and immunities
# granted to it by virtue of its status as an intergovernmental organisation
# nor does it submit to any jurisdiction.
#

import metview as mv

# define data values
val_x = [0.2, 0.4, 0.6, 0.7]
val_y = [0.1, 0.3, 0.5, 0.8]

# define the Taylor diagram grid
grid = mv.mtaylor(
    taylor_primary_grid_increment=0.1,
    taylor_secondary_grid="on",
    taylor_secondary_grid_increment=0.1,
    taylor_secondary_grid_line_colour="RGB(0.28,0.58,0.11)",
    taylor_secondary_grid_line_style="dash",
    taylor_secondary_label_colour="RGB(0.33,0.58,0.16)",
)

# define the view
view = mv.cartesianview(
    map_projection="taylor", page_frame="off", subpage_frame="off", taylor_grid=grid
)

# define the input visualiser
vis = mv.input_visualiser(input_x_values=val_x, input_y_values=val_y)

# define symbol plotting
symbol = mv.msymb(
    symbol_type="marker",
    symbol_marker_index=15,
    symbol_colour="red",
    symbol_height=0.5,
    symbol_outline="on",
    symbol_outline_thickness=2,
)

# define the output plot file
mv.setoutput(mv.pdf_output(output_name="taylor"))

# generate the plot
mv.plot(view, vis, symbol)