input_visualiser

Defines the visualisation of list/ndarray data. The generated object can be used directly in plot().
Note
This function performs the same task as the Input Visualiser icon in Metview’s user interface. It accepts its parameters as keyword arguments, described below.
- input_visualiser(**kwargs)
Defines the visualisation of list/ndarray data.
- Parameters
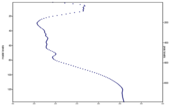
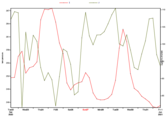
input_plot_type (str, default: "xy_points") –
Specifies the type of plot to be generated. This also implicitly specifies the type of data which will be entered. The available modes are as follows:
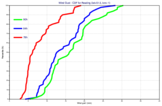
”xy_points”
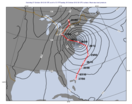
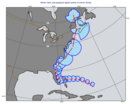
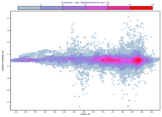
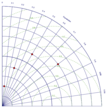
”geo_points”
”xy_area”
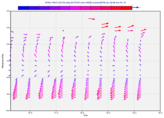
”xy_vectors”
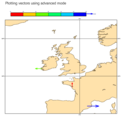
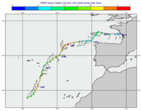
”geo_vectors”
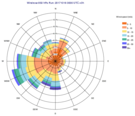
”xy_binning”: the points will be gridded specified by
input_binning.”geo_binning”: the points will be gridded specified by
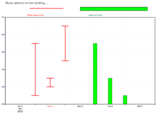
input_binning.”xy_boxplot”
input_x_type ({"number", "date"}, default: "number") – Specifies how the X values should be interpreted. Only available when
input_plot_typeis “xy_*”.input_y_type ({"number", "date"}, default: "number") – Specifies how the Y values should be interpreted. Only available when
input_plot_typeis “xy_*”. type plots.input_x_values (ndarray or list of numbers) – The x-coordinate values. Only available when
input_plot_typeis “xy_*” andinput_x_typeis “number”.input_y_values (ndarray or list of numbers) – The y-coordinate values. Only available when
input_plot_typeis “xy_*” andinput_y_typeis “number”.input_x2_values (ndarray or list of numbers) – The second x-coordinate values. Only available when
input_plot_typeis “xy_area” andinput_x_typeis “number”.input_y2_values (ndarray or list of numbers) – The second y-coordinate values. Only available when
input_plot_typeis “xy_area” andinput_y_typeis “number”.input_x_missing_value (number, default: -21.e6) – Specifies the value which will be considered “missing” when plotting. Only available when
input_plot_typeis “xy_*” andinput_x_typeis “number”.input_y_missing_value (number, default: -21.e6) – Specifies the value which will be considered “missing” when plotting. Only available when
input_plot_typeis “xy_*” andinput_y_typeis “number”.input_date_x_values (list of datetime.datetime) – The dates used as x-coordinate values. Only available when
input_plot_typeis “xy_*” andinput_x_typeis “date”.input_date_y_values (list of datetime.datetime) – The dates used as y-coordinate values. Only available when
input_plot_typeis “xy_*” andinput_y_typeis “date”.input_date_x2_values (list of datetime.datetime) –
input_date_y2_values (list of datetime.datetime) –
input_longitude_values (ndarray or list of numbers) – The longitude values. Only available when
input_plot_typeis “geo_*”.input_latitude_values (ndarray or list of numbers) – The latitude values. Only available when
input_plot_typeis “geo_*”.input_x_component_values (ndarray or list of numbers) – The x vector component values. Only available when
input_plot_typeis “*_vectors”.input_y_component_values (ndarray or list of numbers) – The y vector component values. Only available when
input_plot_typeis “*_vectors”.input_values (ndarray or list of numbers) – Specifies the actual values at the points whose coordinates are given in the other parameters.
input_minimum_values (ndarray or list of numbers) – The minimum values when
input_plot_typeis “xy_boxplot”.input_maximum_values (ndarray or list of numbers) – The maximum values when
input_plot_typeis “xy_boxplot”.input_median_values (ndarray or list of numbers) – The median values when
input_plot_typeis “xy_boxplot”.input_box_upper_values (ndarray or list of numbers) – The upper quartile (75%) values when
input_plot_typeis “xy_boxplot”.input_box_lower_values (ndarray or list of numbers) – The lower quartile (25%) values when
input_plot_typeis “xy_boxplot”.input_binning (
binning()) – Specifies the binning. Available whentable_plot_typeid “*_binning”.
- Return type
Request