Note
Click here to download the full example code
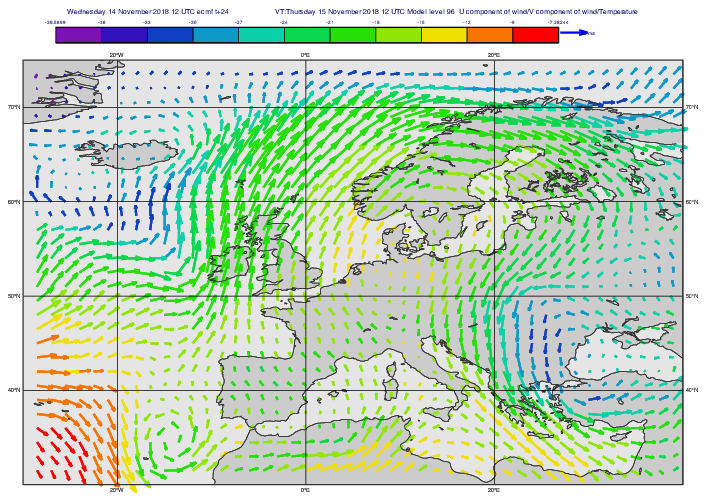
GRIB - Wind Coloured by Temperature
# (C) Copyright 2017- ECMWF.
#
# This software is licensed under the terms of the Apache Licence Version 2.0
# which can be obtained at http://www.apache.org/licenses/LICENSE-2.0.
#
# In applying this licence, ECMWF does not waive the privileges and immunities
# granted to it by virtue of its status as an intergovernmental organisation
# nor does it submit to any jurisdiction.
#

import metview as mv

# read grib file - contains model level data, one timestep
filename = "fc_ml.grib"
if mv.exist(filename):
    fs = mv.read(filename)
else:
    fs = mv.gallery.load_dataset(filename)

# define model level to read
level = 96  # around 500 hPa

# read temperature and scale it to C
t = mv.read(data=fs, param="t", level=level)
t = t - 273.16

# read wind components
u = mv.read(data=fs, param="u", level=level)
v = mv.read(data=fs, param="v", level=level)

# define wind plotting - will be coloured by temperature
wp = mv.mwind(
    wind_thinning_factor=1,
    legend="on",
    wind_advanced_method="on",
    wind_advanced_colour_parameter="parameter",
    wind_advanced_colour_max_level_colour="red",
    wind_advanced_colour_min_level_colour="violet",
    wind_advanced_colour_direction="clockwise",
    wind_arrow_unit_velocity=35,
    wind_arrow_thickness=2,
)

# define coastlines
coast = mv.mcoast(
    map_coastline_land_shade="on",
    map_coastline_land_shade_colour="RGB(0.8,0.8,0.8)",
    map_coastline_sea_shade="on",
    map_coastline_sea_shade_colour="RGB(0.9,0.9,0.9)",
    map_coastline_colour="RGB(0.2,0.2,0.2)",
    map_coastline_resolution="medium",
)

# define geo view
view = mv.geoview(
    coastlines=coast, map_area_definition="corners", area=[30, -30, 75, 40]
)

# define the vector structure for plotting - wind will be coloured by t
v = mv.grib_vectors(u_component=u, v_component=v, colouring_field=t)

# define the output plot file
mv.setoutput(mv.pdf_output(output_name="wind_coloured_by_t"))

# generate plot
mv.plot(view, v, wp)