Note
Click here to download the full example code
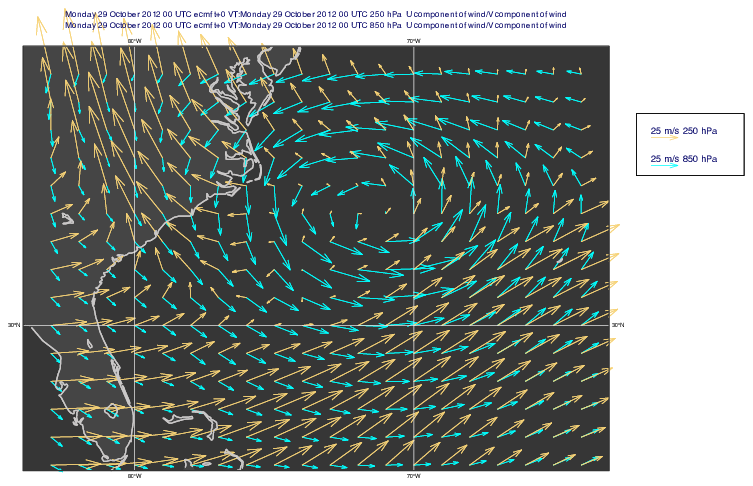
GRIB - Wind Field Overlay and Legend Box
# (C) Copyright 2017- ECMWF.
#
# This software is licensed under the terms of the Apache Licence Version 2.0
# which can be obtained at http://www.apache.org/licenses/LICENSE-2.0.
#
# In applying this licence, ECMWF does not waive the privileges and immunities
# granted to it by virtue of its status as an intergovernmental organisation
# nor does it submit to any jurisdiction.
#

import metview as mv

# read grib data
filename = "sandy_pl.grib"
if mv.exist(filename):
    f = mv.read(filename)
else:
    f = mv.gallery.load_dataset(filename)

# filter wind on tow pressure levels
f1 = mv.read(data=f, param=["u", "v"], levelist=850)
f2 = mv.read(data=f, param=["u", "v"], levelist=250)

# define wind plotting on lower level
wp_1 = mv.mwind(
    wind_thinning_factor=1,
    legend="on",
    wind_arrow_colour="cyan",
    wind_arrow_legend_text="m/s 850 hPa",
)

# define wind plotting on upper level
wp_2 = mv.mwind(
    wind_thinning_factor=1,
    legend="on",
    wind_arrow_colour="RGB(0.9641,0.8222,0.4634)",
    wind_arrow_legend_text="m/s 250 hPa",
)

# define coastlines
coast = mv.mcoast(
    map_coastline_colour="RGB(0.794,0.7824,0.7824)",
    map_coastline_thickness=2,
    map_coastline_land_shade="on",
    map_coastline_land_shade_colour="RGB(0.2706,0.2706,0.2706)",
    map_coastline_sea_shade="on",
    map_coastline_sea_shade_colour="RGB(0.2118,0.2118,0.2118)",
    map_grid_colour="RGB(0.8941,0.8941,0.8941)",
    map_grid_longitude_increment=10,
)

# define map view
view = mv.geoview(
    map_area_definition="corners", area=[24.8, -84, 40, -63], coastlines=coast
)

# define legend
legend = mv.mlegend(
    legend_box_mode="positional",
    legend_text_font_size=0.4,
    legend_entry_plot_direction="column",
    legend_box_x_position=25,
    legend_box_y_position=12,
    legend_box_x_length=4,
    legend_box_y_length=2.3,
    legend_box_blanking="on",
    legend_border="on",
    legend_border_colour="black",
    legend_entry_text_width=5,
)

# define title
title = mv.mtext(text_font_size=0.35)

# define the output plot file
mv.setoutput(mv.pdf_output(output_name="wind_overlay_and_legend_box"))

# generate plot
mv.plot(view, f1, wp_1, f2, wp_2, legend, title)