On screen weather symbol editing
How to start the symbol editor?
Start Metview’s plot window by visualising something, open the sidebar and select the Symbols tab:
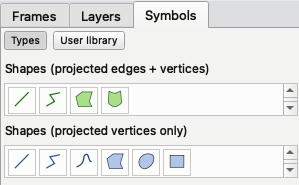
It contains two pages:
Types: shows all the symbol types that can be added to the plot
User library: provides access to the User library of saved weather symbols
How to add a new item to the plot?
Just click on the item in the sidebar in Types page, the cursor changes into a cross, then click on the map to add the item.
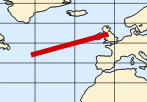
Lines
When you are creating a line, double click to conclude the creation.
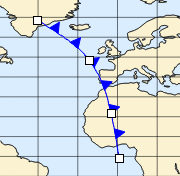
Polylines, curves and fronts
When you are creating a polyline or a curve each left-click on the map adds a new point and double-click concludes the creation.
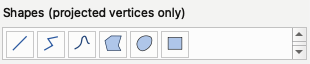
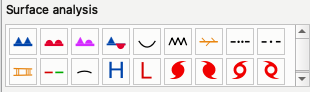
What kind of symbol are available?
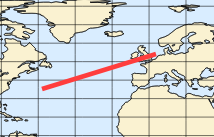
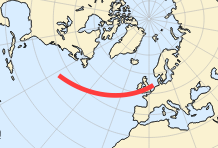
Fully projected geo-shapes
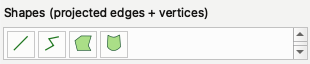
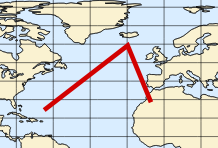
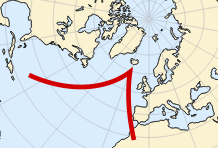
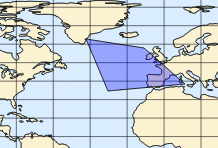
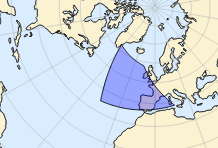
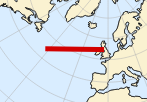
These are special shapes where all the vertices keep their lat-lon positions as the projection changes and the edges between them are sampled linearly in lat-lon space. It means that in cylindrical projection the edges are always straight lines, while in other projections they might be curves. The following table shows how a fully projected geo-shape changes as the projection changes from cylindrical to polar north:
Shape |
Cylindrical |
Polar North |
|---|---|---|
Proj Line |
|
|
Proj Polyline |
|
|
Proj Polygon |
|
|
Proj Quad |
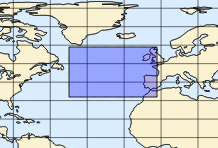
|
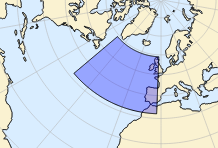
|
For the Proj Quad the corner points always form a rectangle in the lat-lon space!
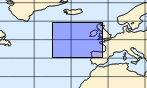
Projected geo-shapes
In these shapes all the vertices keep their lat-lon positions as the projection changes and they are always connected with a straight line (or with a B-Spline for curves) in all the projections.
The rectangle is a special object because it always keeps its rectangular shape. It means that if we zoom, the lat-lon positions of the corner points do not change. However, if we change the projection the lat-lon positions of the corners are automatically adjusted so that the shape will be a rectangle in the new projection.
Object |
Cylindrical |
Polar North |
|---|---|---|
Line |
|
|
Rectangle |
|
|
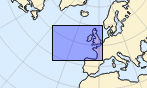
Markers and text
For these objects only the anchor point (see below) keeps its lat-lon position as the projection changes, while the extent is defined in terms of pixels:
Object |
Cylindrical |
Polar North |
|---|---|---|
Text |
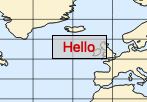
|
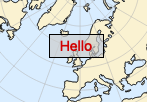
|
Placemark |
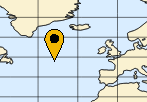
|
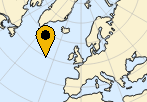
|
The anchor position depends on the object type:
for a text box it is the top left corner
for a placemark it is the tip of the symbol (bottom-centre)
for the other shapes it is the centre
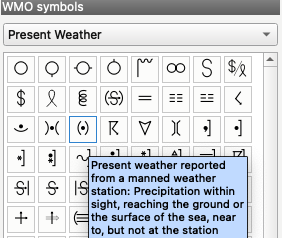
WMO symbols
All the WMO weather symbols are available here. They behave like markers, i.e. their centre keeps its lat-lon position when the projection changes and the extent is defined in pixels.
How can I edit the symbols?
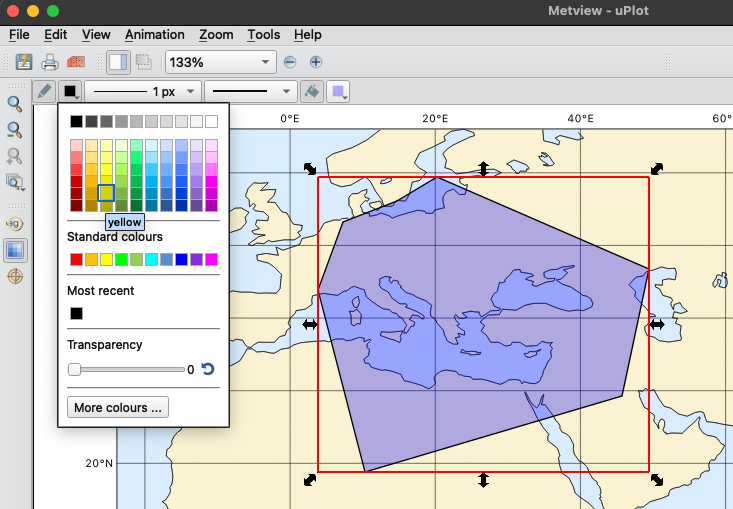
First, make sure you are not in zoom mode, because clicks will be taken as zooms! Single click on the symbol: it gets into edit mode where you can move and resize it and edit its graphical properties from the ribbon editor at the top of the view area. Note that the filled shapes allow you to remove the filling and just keep the outline. Also note that all the ‘line’ objects can have arrow heads.
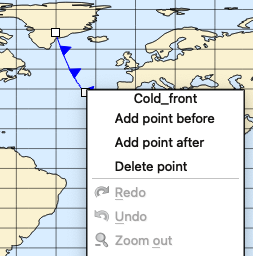
How can I edit the points on a polyline, curve or front?
Double click the symbol and the control points become visible. You can drag them now to a new location.
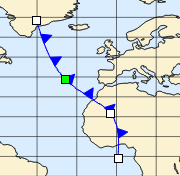
You can add/remove points to a curve when you are in the point edit mode. Right click on a control point and use the actions in the context menu:
How can I edit the text?
The text item has two modes: a normal mode and an edit mode where the text can be interactively typed in or altered. In edit mode a frame is rendered around the text item to distinguish it from the normal mode.
Normal mode |
Edit mode |
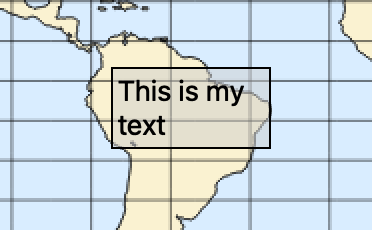
|
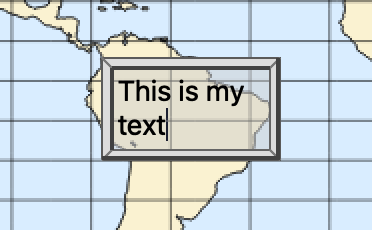
|
To enter the edit mode double-click on the item. To leave the edit mode click outside the item. You can also drag an edited item by the editor frame (the item will switch automatically into normal mode). Please note that when a text item is created it automatically appears on the screen in edit mode.
How do I add an arrow?
Just add any of the line objects (including polylines) and go to the property editor to add arrow heads to either or both ends of the line.
Can I rotate the objects?
It is not yet available.
Is redo-undo available?
Yes, there is a redo-undo functionality for all the symbol operations. You can access it via the toolbar buttons or using the Ctrl+Z (undo) Shift+Ctrl+Z (redo) shortcuts:
Please note that when performing zoom or dropping an icon into the plot the undo history is cleared.
Can I drag symbols out of the map area?
It is only possible for the markers, the text and the WMO symbols. The other symbols and shapes are all clipped to the map area, so any parts outside of it become invisible. The policy is even stricter for the fully projected geo-shapes: these are fully bound to the map area and none of their points or edges can be moved outside!
How does clipping work?
The clipping policy is based on the object type.
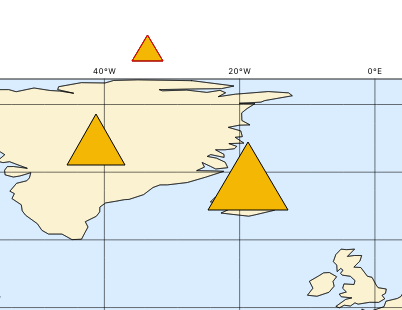
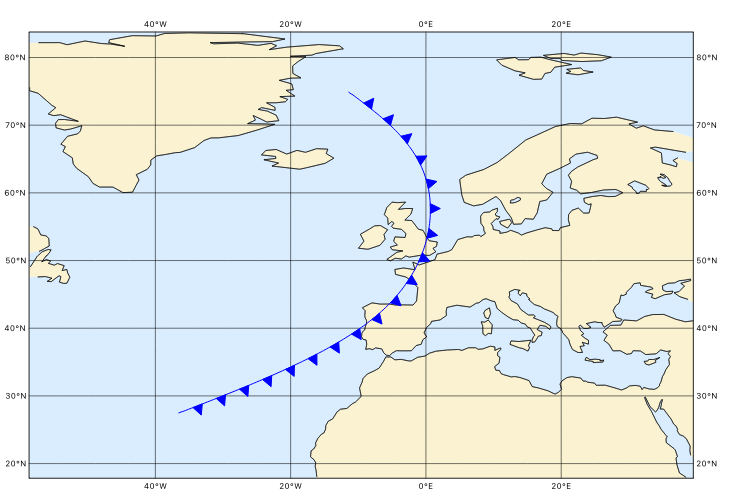
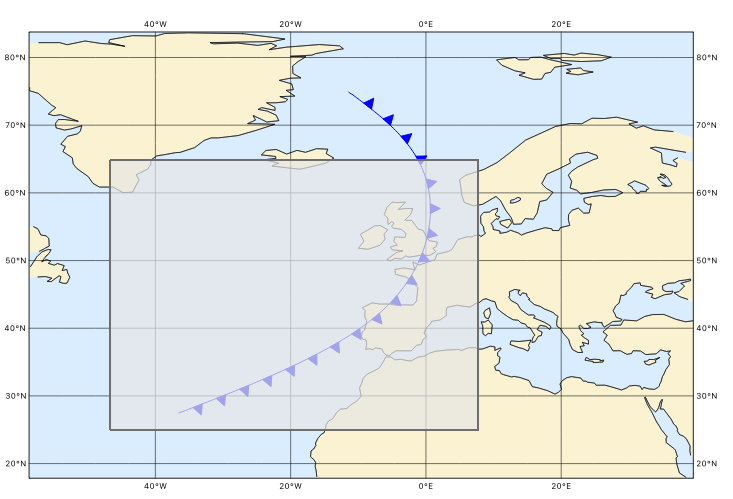
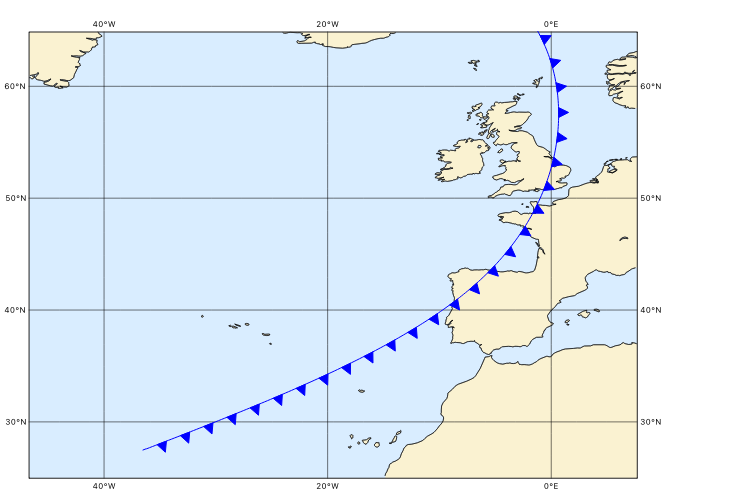
For markers, text and WMO symbols no clipping is applied. However, when we zoom the following things happen:
items that were outside the map area stay at their scene (i.e. window) position
items that were inside the map area before zoom but get out of the map will be hidden. They become visible again when we unzoom.
The snapshots below illustrates how it works.
Before zoom |
Zoom |
After zoom |
|
|
|
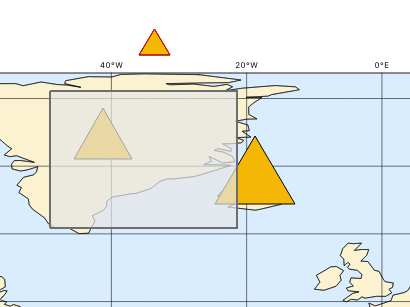
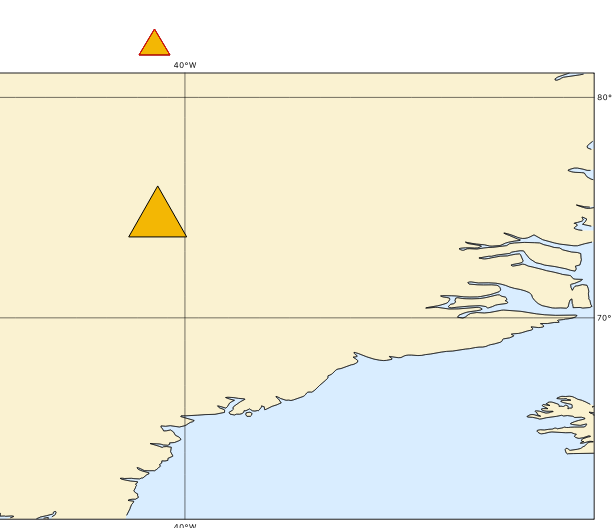
For all the other types clipping is always applied (the example below shows how it works for a cold front).
Before zoom |
Zoom |
After zoom |
|
|
|
Fully projected geo-shapes are fully bound to the map area and none of their points or edges can be moved outside!
How to generate a PNG or PDF from the scene?
Just use the Export button in the toolbar and choose between the PDF_QT or PNG_QT output formats.
Alternatively, just take a screenshot!
How do these features behave across different time steps in the plot?
The symbols are preserved as they are between time steps; you cannot define different sets of symbols, or move them between time steps.