mvl_geopolyline
- mvl_geopolyline(lat, lon, incr)
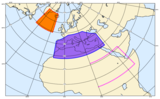
Plots a polygon linearly sampled in lat-lon onto any map projections.
- Parameters
lat (list or ndarray) – latitudes of the polygon points
lon (list or ndarray) – longituded of the polygon points
incr (number) – increment in degrees for line segments to build up the lines between adjacent polygon points
- Return type
Internally, the lines between adjacent polygon points are split into a number of segments. The returned result is an
input_visualiser()object which can be passed toplot()along with an optionalmgraph()object.