Note
Click here to download the full example code
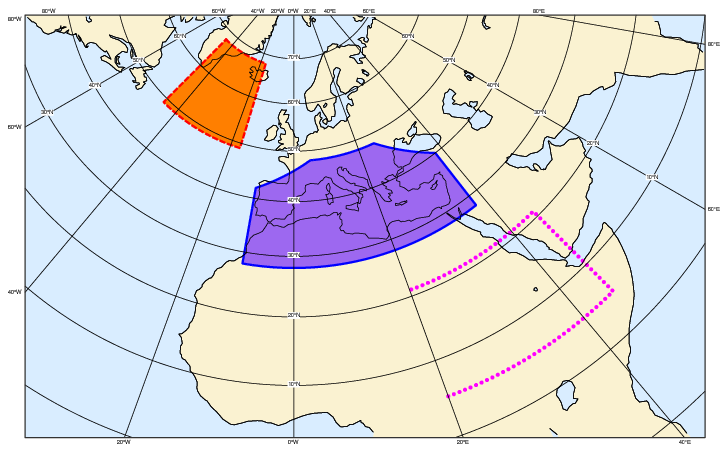
Geopolyline on Map
# (C) Copyright 2017- ECMWF.
#
# This software is licensed under the terms of the Apache Licence Version 2.0
# which can be obtained at http://www.apache.org/licenses/LICENSE-2.0.
#
# In applying this licence, ECMWF does not waive the privileges and immunities
# granted to it by virtue of its status as an intergovernmental organisation
# nor does it submit to any jurisdiction.
#


import metview as mv


# set up the shaded coastlines
land_sea_shade = mv.mcoast(
    map_coastline_land_shade="on",
    map_coastline_land_shade_colour="RGB(0.98,0.95,0.82)",
    map_coastline_sea_shade="on",
    map_coastline_sea_shade_colour="RGB(0.85,0.93,1)",
)

# define the geographic view
view = mv.geoview(
    map_projection="polar_stereographic",
    map_area_definition="corners",
    area=[-5, -30, 10, 84],  # S,W,N,E
    coastlines=land_sea_shade,
)

pltLst = []

# first polyline (closed) - with shading
latPos = [68, 68, 49, 49, 68]
lonPos = [-45, -17, -17, -45, -45]
incr = 1

# define visualiser
vis = mv.mvl_geopolyline(latPos, lonPos, incr)

# define shading and border
graph_area = mv.mgraph(
    graph_type="area",
    graph_shade_colour="orange",
    graph_line_colour="red",
    graph_line_thickness="4",
    graph_line_style="dash",
)

pltLst.extend([vis, graph_area])

# second polyline (closed) - with shading

latPos = [48, 48, 40, 28, 28, 42, 48]
lonPos = [5, 25, 38, 38, -10, -10, 5]
incr = 1

# define visualiser
vis = mv.mvl_geopolyline(latPos, lonPos, incr)

# define shading and border
graph_area = mv.mgraph(
    graph_type="area",
    graph_shade_colour="lavender",
    graph_line_colour="blue",
    graph_line_thickness="4",
    graph_line_style="solid",
)
pltLst.extend([vis, graph_area])

# third polyline (open) - outline only

latPos = [21, 21, 5, 5]
lonPos = [20, 45, 45, 20]
incr = 1

# define visualiser
vis = mv.mvl_geopolyline(latPos, lonPos, incr)

# define shading and border
graph_line = mv.mgraph(
    graph_type="curve",
    graph_line_colour="purple",
    graph_line_thickness="4",
    graph_line_style="dot",
)

pltLst.extend([vis, graph_line])

# define the output plot file
mv.setoutput(mv.pdf_output(output_name="geopolyline_on_map"))

# plot the polygons on the map
mv.plot(view, pltLst)