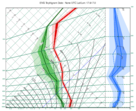
xy_area
- xy_area(x, y, colour)
Convenience function to build an area (i.e. a polygon) to be plotted in a
cartesianview()with the givencolour.- Parameters
x (list or ndarray) – x coordinates of the polygon points
y (list or ndarray) – y coordinates of the polygon points
colour (str) – fill colour of the area
- Return type
list of
input_visualiser()andmgraph()
Returns a list containing an
input_visualiser()and anmgraph(), which can be directly used inplot().
