Note
Click here to download the full example code
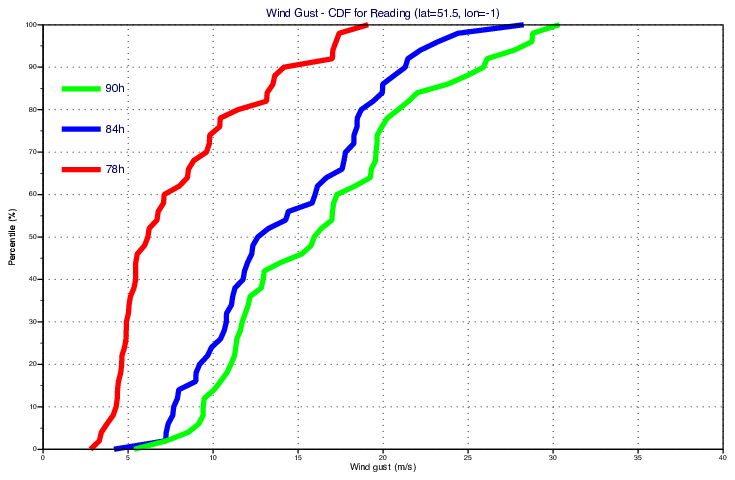
GRIB - CDF Curve
# (C) Copyright 2017- ECMWF.
#
# This software is licensed under the terms of the Apache Licence Version 2.0
# which can be obtained at http://www.apache.org/licenses/LICENSE-2.0.
#
# In applying this licence, ECMWF does not waive the privileges and immunities
# granted to it by virtue of its status as an intergovernmental organisation
# nor does it submit to any jurisdiction.
#

import numpy as np
import metview as mv

# define location
lat = 51.5
lon = -1
stat_name = "Reading"

plot_lst = []
legend_lst = []
linecolor = ["red", "blue", "green", "black", "cyan", "evergreen", "gold", "pink"]

# get ENS data
filename = "wgust_ens.grib"
if mv.exist(filename):
    g = mv.read(filename)
else:
    g = mv.gallery.load_dataset(filename)

# compute CDF and build curve for each timestep
steps = [78, 84, 90]
for i in range(len(steps)):
    # get data for timestep
    f = mv.read(data=g, step=steps[i])

    # compute CDF
    v = mv.nearest_gridpoint(f, lat, lon)
    y = np.arange(0, 101)
    x = np.percentile(v, y)

    # define curve
    vd = mv.mgraph(
        graph_line_style="solid",
        graph_type="curve",
        graph_line_colour=linecolor[i],
        graph_line_thickness=10,
        legend="on",
    )

    curve = mv.input_visualiser(input_x_values=list(x), input_y_values=list(y))
    plot_lst.append([curve, vd])

    # define legend text
    legend_lst.append("{}h".format(steps[i]))

# define title
title = mv.mtext(
    text_line_1="Wind Gust - CDF for {} (lat={}, lon={})".format(stat_name, lat, lon),
    text_font_size=0.5,
)

# define legend
legend = mv.mlegend(
    legend_display_type="disjoint",
    legend_entry_plot_direction="column",
    legend_text_composition="user_text_only",
    legend_border_colour="black",
    legend_box_mode="positional",
    legend_box_x_position=2.5,
    legend_box_y_position=12,
    legend_box_x_length=5,
    legend_box_y_length=5,
    legend_text_font_size=0.5,
    legend_user_lines=legend_lst,
)

# define horizontal axis
hor_axis = mv.maxis(
    axis_position="left",
    axis_title_text="Wind gust (m/s)",
    axis_tick_interval=5,
    axis_minor_tick="off",
    axis_grid="on",
    axis_grid_colour="black",
    axis_grid_line_style="dot",
)

# define vertical axis
ver_axis = mv.maxis(
    axis_orientation="vertical",
    axis_title_text="Percentile (%)",
    axis_tick_interval=10,
    axis_minor_tick="on",
    axis_minor_tick_count=1,
    axis_grid="on",
    axis_grid_colour="black",
    axis_grid_line_style="dot",
)

# define Cartesian view
view = mv.cartesianview(
    x_min=0,
    x_max=40,
    y_min=0,
    y_max=100,
    subpage_y_position=12.5,
    subpage_y_length=75,
    horizontal_axis=hor_axis,
    vertical_axis=ver_axis,
)


# define the output plot file
mv.setoutput(mv.pdf_output(output_name="cdf_curve"))

# plot
mv.plot(view, plot_lst, legend, title)